


This topic describes the performance metrics of Oracle Store and when and how to adjust these metrics.
Metrics in connector.log
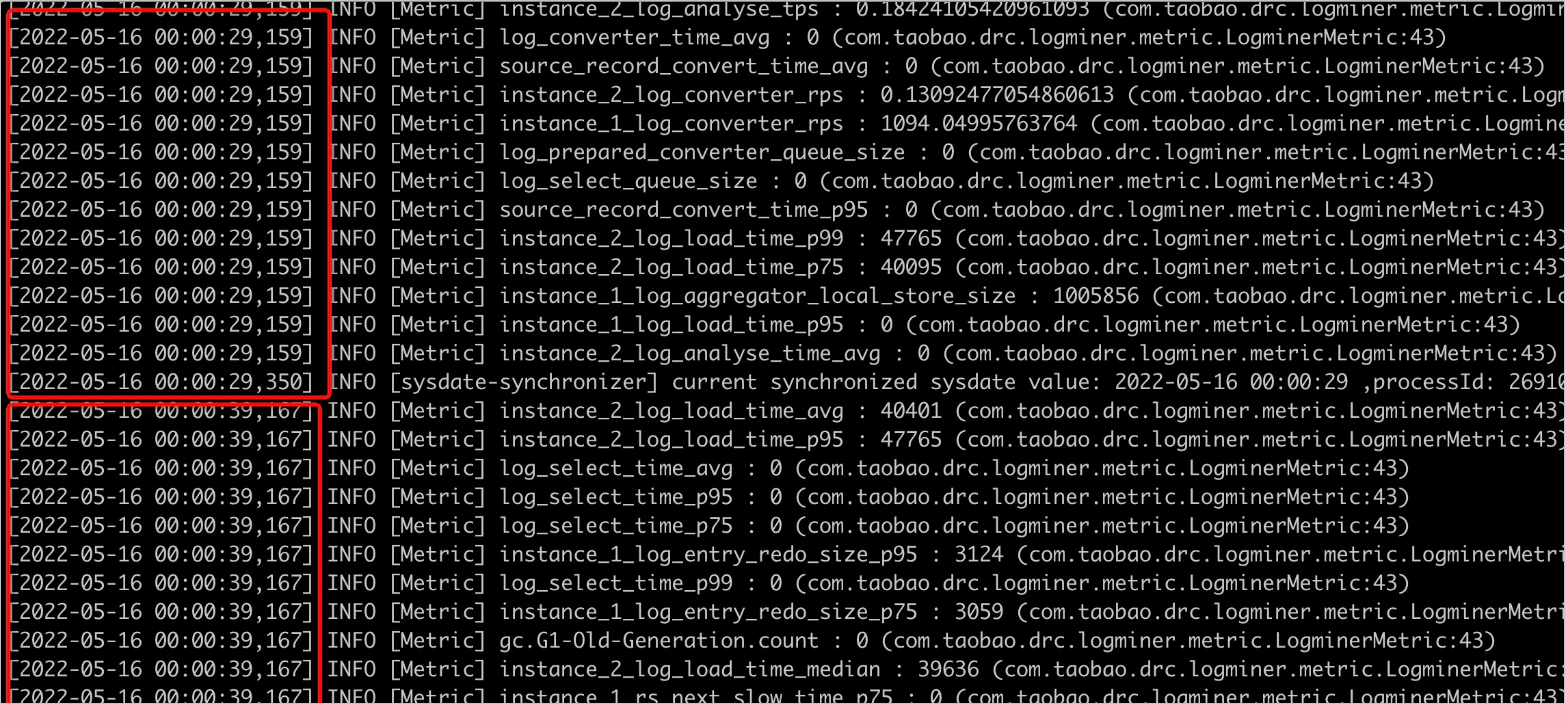
Oracle Store prints monitoring logs in connector.log once every 10s to monitor the data backlog in each queue, which helps you troubleshoot processing bottlenecks. You can run the grep command to search for the corresponding queue information by using the following keywords and check the changes over a period of time. The default size of each queue is 20000.
log_entry_queue_size: The data obtained from LogMiner is directly pushed to the queue. If the value remains at 0, OMS is bottlenecked when it pulls incremental data from the Oracle database. This may be caused by the following issues:The load on the Oracle server is too large, resulting in slow operation of LogMiner.
The network between the OMS server and the Oracle server is unstable, or the two servers are not in the same region, resulting in slow data transmission.
If neither is the case, search for
start loading log entries from log filein theconnector.logfile to check whether the log file being analyzed is an archive file. If the file is an archive file, the single logminer thread may have reached its performance limit. You need to configure concurrent logminer threads by using the following metrics:deliver2store.logminer.fetch_arch_logs_max_parallelism_per_instanceanddeliver2store.logminer.max_actively_staged_arch_logs_per_instance. Setdeliver2store.logminer.max_actively_staged_arch_logs_per_instanceto2 * deliver2store.logminer.fetch_arch_logs_max_parallelism_per_instance.
For example, you can set
deliver2store.logminer.fetch_arch_logs_max_parallelism_per_instance=3,deliver2store.logminer.max_actively_staged_arch_logs_per_instance=6. Concurrent pulling takes up more memory. Therefore, when you adjust these two metrics, you must increase the JVM memory of the corresponding Oracle Store as well.log_analyse_queue_size: The length of the data output queue after the Oracle Store parses the result returned by the LogMiner. If the queue is empty, OMS is bottlenecked in log parsing.log_aggregator_queue_size: The number of records being assembled. This metric alone does not assist in troubleshooting. It must be used along with thelog_converter_queue_sizemetric.log_converter_queue_size: The length of the output queue of data conversion. If the value this metric is 0, OMS is bottlenecked on the converter and aggregator. If the value of thelog_aggregator_queue_sizemetric is close to 20000, you need to increase the number of converter threads, specified by thedeliver2store.logminer.converter_thread_nummetric. The default value is 8.log_select_queue_size: The length of the entry queue of flashback queries. If the queue size is close to 20000, OMS is bottlenecked in flashback queries. In this case, increase the number of flashback query threads, which is specified by thedeliver2store.logminer.selector_thread_nummetric. The default value is 32.connect_task_queue_size: The length of the output queue of the LogMiner reader. If the value is 0, no bottleneck exists in the downstream. If the value is not 0, a bottleneck occurs in the Store framework.log_aggregator_local_store_size: The number of uncommitted transactions cached by Oracle Store. A larger value of this metric indicates more records of uncommitted transactions in Oracle. You can collect values of this metric over a period of time. If the metric remains at a large value and suddenly drops, a large transaction exists in Oracle. Oracle Store will start processing only after the large transaction is committed, which causes a certain delay. You can check whether the large transaction can be broken into small ones from the business perspective, so that Oracle Store can process and output data in time.log_aggregator_in_disk_transaction_num: The number of transactions cached to the disk. When the number of records for a transaction exceeds the value of thedeliver2store.logminer.max_num_in_memory_one_transactionmetric (default value: 1000), the transaction is cached to the disk. When a large transaction exists and the JVM memory can be increased, you can increase the value ofdeliver2store.logminer.max_num_in_memory_one_transactionto cache the transaction in memory as much as possible to improve processing efficiency.
Check whether garbage collection occurs in Oracle Store
When the efficiency is low, check whether garbage collection occurs in the Oracle store. Garbage collection may slow down data processing in the Oracle store. Eventually, all processing queues are jammed, resulting a stuck process.
Check garbage collection in connector.log
Search for the gc.G1-Old-Generation.count and gc.G1-Young-Generation.count metrics in the connector.log file. Check whether the values of these two metrics, especially the value of gc.G1-Old-Generation.count, are continuously increasing. Then, you can determine whether garbage collection occurs in the process, and whether the JVM memory needs to be increased.
Use the jstat command to check garbage collection in real time
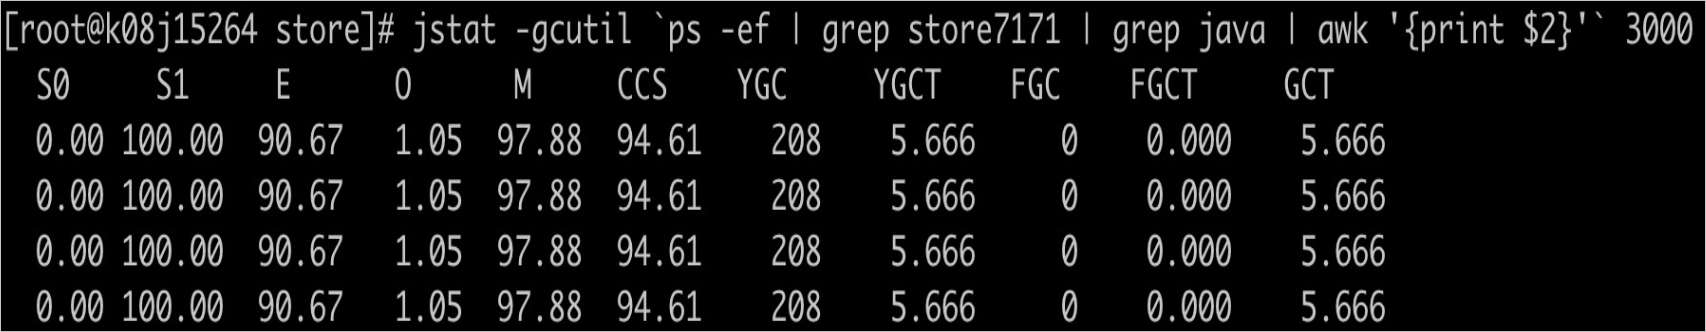
Log on to the OMS container and run the following command to view the real-time garbage collection of the corresponding Oracle store. Before you execute the command, replace storexxxx with the ID of the corresponding Oracle store. After the command is executed, information about real-time garbage collection is printed every 3s. Focus on the FGC and FGCT metrics, which respectively indicate the number of full garbage collections and the time consumed since the process was started. When the FGC value increases continuously or the FGCT value accounts for over 10% the total running time of the process, you need to increase the JVM memory of the Oracle store.
jstat -gcutil `ps -ef | grep storexxxx | grep java | awk '{print $2}'` 3000
Adjust the JVM memory of Oracle Store
Adjust the JVM memory for a specified Oracle store
Stop the store.
Log on to the OMS console.
In the left-side navigation pane, choose OPS & Monitoring > Component. The Store tab automatically appears.
On the Store tab, click Pause in the Actions column of the target store, which must be in the Running state.
For single-region deployment, the region information is displayed on the right of Store.
For multi-region deployment, you can filter stores by region and pause the stores that are not running in the target region.
In the dialog box that appears, click OK.
Go to the
/home/ds/store/storeXXX/kafka/bindirectory on the OMS server, and modify the value ofKAFKA_HEAP_OPTSin theconnect-drcdeliver.shfile to modify the JVM memory. For example, change the value to-Xms32g -Xmx32g -Xmn8g. Generally, the three values in the string is in the 4:4:1 ratio. You can set them to reasonable values based on the total memory on the server.On the OMS console, choose OPS & Monitoring > Component > Store, and start the store.
Adjust the JVM memory for all Oracle stores
On the OMS server, go to the /home/ds/kafka/bin directory to modify the JVM memory. For more information, see Step 2. After the modification is completed, the new JVM configuration takes effect on all newly started Oracle stores.
Configure store parameters
Log on to the OMS console.
In the left-side navigation pane, click Data Migration.
In the Migration Projects list, click the name of the target project to go to its details page.
Click View Component Monitoring in the upper-right corner.
In the View Component Monitoring dialog box, click Update in the Actions column of the target component.
In the Update Configurations dialog box, hover the pointer over the parameter to be modified and click the edit icon that appears.
Modify the value in the text box and then click the confirm icon.
You can also hover the pointer over the blank area after
rootand click the add icon to add a key-value pair.After you modify the YAML configuration as required, click Update.
After the update is completed, Oracle Store automatically restarts to make the parameter changes take effect.