


OceanBase Cloud Platform (OCP) allows you to monitor the performance and resource usage of OceanBase clusters, OceanBase Database tenants, OBProxy clusters, and OBProxy hosts. You can view the monitoring data to learn about the status, performance, and resource usage of each monitored object. This way, you can ensure the availability of follow-up businesses by adjusting resource allocation in time. You can also troubleshoot business exceptions based on the monitoring data.
Overview
The following table lists the four dimensions from which a metric and its sub-metrics are described.
Dimension |
Remarks |
|---|---|
| Metric introduction | A brief introduction to the statistics monitored by the metric. |
| Parameter description | The information that further describes the metric. The following three parts are included: |
| Calculation expression | Specifies how monitoring data is generated. |
| SQL statements for metric collection | The SQL source for monitoring metrics collection.The SQL collection of different OceanBase Database versions is different, you can check it according to the actual situation.
NOTE |
Principle of monitoring
The following figure shows the sources and destinations of monitoring data.
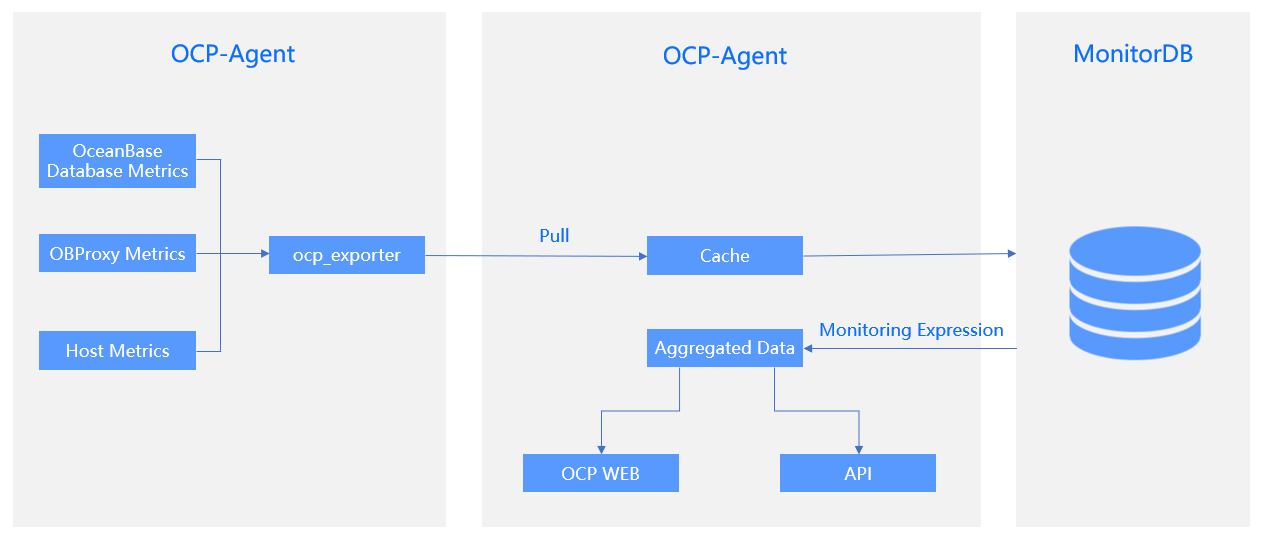
Monitoring data is collected by the ocp_exporter process of OCP-Agent based on metrics.
OCP-Server triggers data collection based on the instances in ocp_exporter_address. The collected data is saved in MonitorDB.
The collected data is aggregated and calculated based on the specified calculation expression to generate the statistics to be displayed on console pages. Sample calculation expression:
sum(rate(ob_sysstat{stat_id="40000",@LABELS}[@INTERVAL])) by (@GBLABELS) + sum(rate(ob_sysstat{stat_id="40002",@LABELS}[@INTERVAL])) by (@GBLABELS) + sum(rate(ob_sysstat{stat_id="40004",@LABELS}[@INTERVAL])) by (@GBLABELS) + sum(rate(ob_sysstat{stat_id="40006",@LABELS}[@INTERVAL])) by (@GBLABELS) + sum(rate(ob_sysstat{stat_id="40008",@LABELS}[@INTERVAL])) by (@GBLABELS) + sum(rate(ob_sysstat{stat_id="40018",@LABELS}[@INTERVAL])) by (@GBLABELS)LABELS: the labels based on which data is filtered.
GBLABELS: the dimension from which the selected data is aggregated.
INTERVAL: the granularity of data aggregation. The value is determined by the statistic granularity that you specified.
The generated data is carried by metrics and is displayed in the form of trend charts in the OCP console.
If a metric has sub-metrics, the data is carried by the sub-metrics to the OCP console.
Monitoring data in the OCP console
You can specify a time window, a statistic granularity, and a statistic scope on a monitoring data page in the OCP console to query specific data as needed. To go to the monitoring data page, use one of the following methods:
View the monitoring data of an OceanBase cluster
Log on to the OCP console.
In the Clusters list on the Clusters page, find the target cluster and click its name.
In the left-side navigation pane on the page that appears, click Performance Monitoring .
For more information, see User Guide > Manage clusters > Performance monitoring.
View the monitoring data of an OceanBase Database tenant
Log on to the OCP console.
In the left-side navigation pane, click Tenants .
In the Tenants list, find the target tenant and click its name.
In the left-side navigation pane on the page that appears, click Performance Monitoring .
For more information, see User Guide > Manage tenants > Performance monitoring.
View the monitoring data of an OBProxy cluster
Log on to the OCP console.
In the left-side navigation pane, click OBProxy .
In the Clusters list, find the target cluster and click its name.
In the left-side navigation pane on the page that appears, click Performance Monitoring .
For more information, see User Guide > Manage OBProxy > Monitor OBProxy cluster performance.
View the monitoring data of a host
Log on to the OCP console.
In the left-side navigation pane, click Hosts .
In the Hosts list, find the target host and click its name.
Click the Monitoring tab.
For more information, see User Guide > Manage hosts > Monitor hosts.
Concepts
Collection granularity: the frequency at which the ocp_exporter process collects data from the monitored objects. Data can be collected at a granularity of one or more seconds, minutes, or hours, depending on the metric type.
Time window: the time range of the monitoring data displayed in the OCP console.
Statistic granularity: the granularity at which OCP aggregates the collected data. The granularity can be 1 minute or 1 second. If you set the granularity to 1 minute, minute-level statistics are displayed. If you set the granularity to 1 second, second-level statistics are displayed.
Statistical scope: the scope of displayed monitoring data. OceanBase Database is a distributed database service. The overall monitoring data of a cluster or a tenant is aggregated based on that of all zones or OBServers for the cluster or tenant. By default, the OCP console displays the overall monitoring data of a cluster or a tenant. You can set the statistic scope to a single zone or OBServer. Then, only the monitoring data within the specified scope is displayed.