


OceanBase Cloud Platform (OCP) can push and pull the monitoring data.
In OCP V3.2.0 and earlier, OCP-Agent can only pull the monitoring data. In OCP V3.2.1 and later, OCP-Agent can push the collected monitoring data to your monitoring system. This way, OCP-Agent is connected to your monitoring system and you can customize your monitoring dashboard.
OCP V3.2.1 can push the monitoring data to Pushgateway. OCP V3.3.0 can push the monitoring data to any HTTP API, including Pushgateway and VictoriaMetrics.
OCP-Agent monitoring description
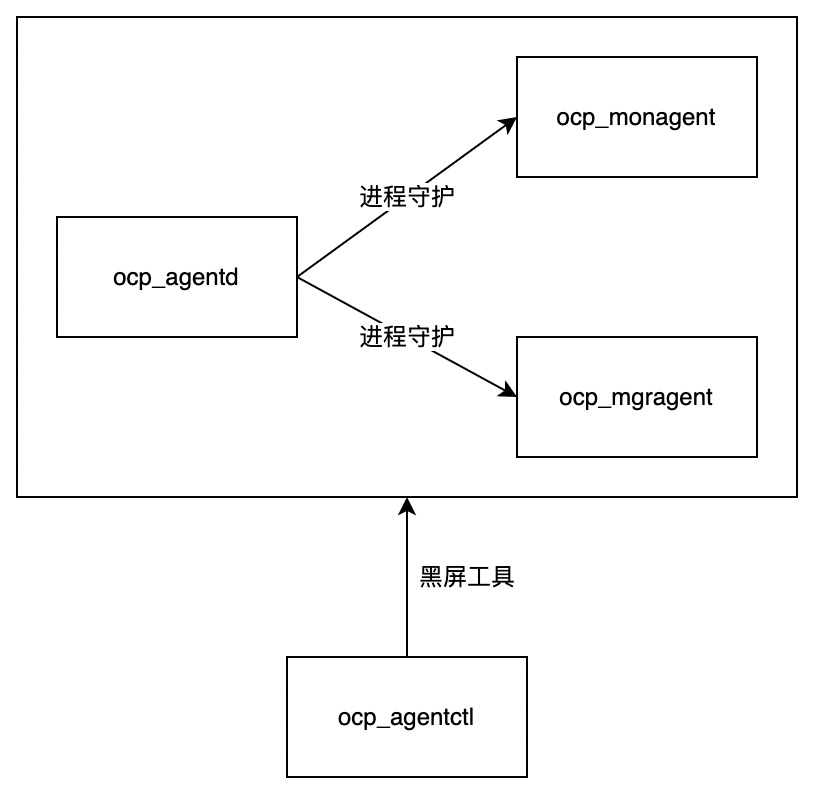
OCP-Agent is a management and monitoring component deployed on the host. It runs with three resident processes and one command-line tool (CLI) process.
The ocp_mgragent process is the management process that executes O&M commands for the OceanBase database and OBProxy.
The ocp_monagent process is the monitoring process that collects monitoring data from the OceanBase database, OBProxy, and host.
The ocp_agentd process is the daemon process of ocp_mgragent and ocp_monagent.
The ocp_agentctl process is the process of the O&M CLI tool.
OCP-Agent generates the following two types of time-series monitoring data in the formats defined in Prometheus:
Business monitoring data, such as the monitoring data of hosts, OceanBase database, clusters, and tenants.
OCP-Agent self-monitoring data related to the running status of OCP-Agent, such as the resource usage by OCP-Agent and the running status of the related processes.
Note
- In OCP V3.2.1 and later, OCP-Agent can push the business monitoring data to your monitoring system. The self-monitoring data is not pushed.
- In addition to the time-series data, OCP-Agent also collects SQL audit data from OceanBase Database for the diagnostic analysis of SQL statements and alert triggering. Log data is collected for analyzing fault causes. Non-time-series data is not included in this topic.
Scheme for pulling time-series monitoring data
In OCP V3.2.0 and later, the monitoring APIs of OCP-Agent support authentication. The authentication uses random passwords that cannot be queried. In OCP V3.3.2, you can disable the authentication. After the authentication is disabled, OCP-Agent can directly pull the monitoring data.
The monitoring APIs are controlled by the ocp.agent.auth.metric-auth-enabled parameter. The default value is true, which indicates that the authentication is enabled. If you set the parameter to false, OCP-Agent can directly pull the monitoring data.
The following table describes the monitoring APIs:
Exporter |
Recommended collection interval |
Description |
|---|---|---|
http://<ip>:62889/metrics/node/host |
1 to 15 seconds | The host monitoring data collected by the node_exporter process. |
http://<ip>:62889/metrics/node/ob |
1 to 15 seconds | The host-level monitoring data after OceanBase Database is deployed, such as the availability of OceanBase services and the status of OceanBase processes. |
http://<ip>:62889/metrics/ob/basic |
1 to 15 seconds | The monitoring data collected from system tables of OceanBase Database. |
http://<ip>:62889/metrics/node/obproxy |
1 to 15 seconds | The host-level monitoring data after OBProxy is deployed, such as the status of the obproxy process. |
http://<ip>:62889/metrics/obproxy |
1 to 15 seconds | The monitoring data of OBProxy collected from http://localhost:2884/metrics. |
http://<ip>:62889/metrics/ob/extra |
1 minute | The monitoring data collected from system tables of OceanBase Database. |
http://<ip>:62888/metrics/stat |
1 minute | The self-monitoring data of the ocp_mgragent process, mainly about the resource usage by the process. |
http://<ip>:62889/metrics/stat |
1 minute | The self-monitoring data of the ocp_monagent process, mainly about the resource usage by the process and the status of monitoring collection pipeline. |
Scheme for pushing time-series monitoring data
Push the monitoring data to Pushgateway
OCP V3.2.1 can push monitoring data to Pushgateway. The following figure shows the deployment architecture.

Pushgateway is a component of the Prometheus ecosystem and supports the push mode. OCP-Agent pushes the monitoring data to Pushgateway. Then, Prometheus pulls the monitoring data from Pushgateway. The process is as follows:
OCP-Server pushes the metadata to OCP-Agent. Metadata includes the monitoring data to be pushed, the push interval, and the push destination.
The monitoring data is pushed to the destination Pushgateway by OCP-Agent, and then pulled by Prometheus.
Configure the Prometheus data source in Grafana to view the monitoring data.
Note
- All OCP-Agent processes obtain the same metadata. You cannot configure different OCP-Agent processes to push the monitoring data to different destinations. If you need to push the monitoring data to different destinations, which cannot be satisfied by Pushgateway, you can build a reverse proxy to achieve the load balancing of push destinations.
- OCP-Agent can push the monitoring data to Pushgateway. However, you must deploy Pushgateway and make sure that OCP-Agent is connected to the monitoring platform.
Push the monitoring data to any HTTP API
To meet diverse requirements in the future, OCP V3.3.0 allows you to push the monitoring data to any HTTP API. The following figure shows the deployment architecture of pushing the monitoring data to VictoriaMetrics.
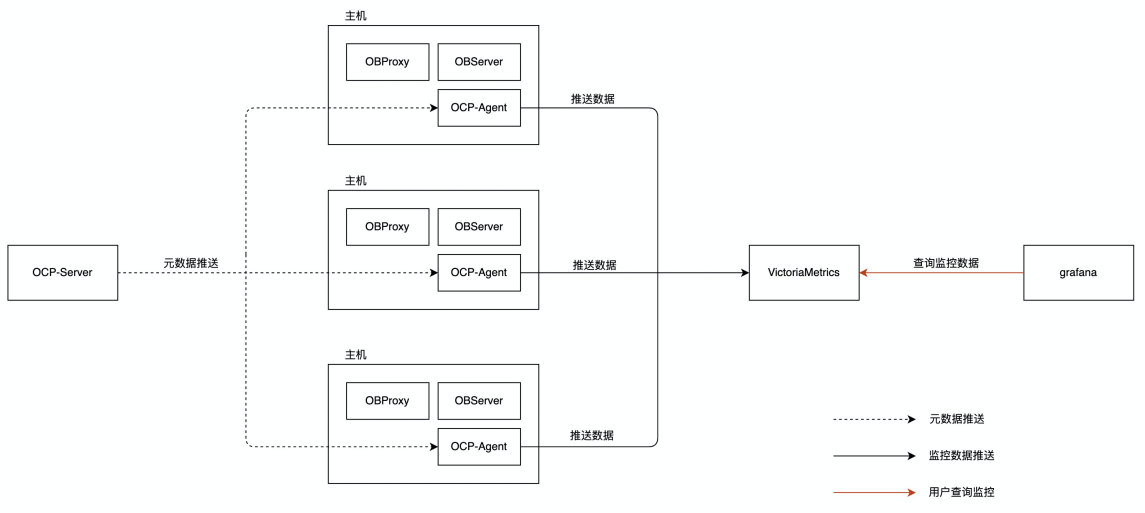
VictoriaMetrics (also called vmagent) is an alternative to Prometheus, but only supports the push mode. Compared with Prometheus, VictoriaMetrics shows great advantages in terms of scalability, performance, and resource usage, and is compatible with Prometheus.
The process is as follows:
OCP-Server pushes the metadata to OCP-Agent. Metadata includes the monitoring data to be pushed, the push interval, and the push destination.
OCP-Agent directly pushes the monitoring data to VictoriaMetrics.
Configure the VictoriaMetrics data source in Grafana by selecting Prometheus to view the monitoring data.
Comparison of Pushgateway and VictoriaMetrics
A stress test is performed by limiting the ocp_monagent process to use a single CPU core. In the test, OCP V3.3.0 is used to push the data to Pushgateway and VictoriaMetrics, respectively. The following table shows the test results.
Destination |
Healthy data throughput |
Data loss rate |
CPU utilization |
Memory usage |
|---|---|---|---|---|
| Pushgateway | 3.8 MB/s | < 1% | 85% | About 200 MB |
| VictoriaMetrics | 7.6 MB/s | Negligible | 99% | About 380 MB |