


Alert description
This alert monitors whether the MemStore usage of a tenant exceeds the limit. If it does, an alert is generated.
Alert principle
The following table describes the key parameters involved in the monitoring logic of this alert.
Parameter |
Value |
|---|---|
| Monitoring metric | ob_tenant_host_memstore_percent |
| Metric source | SQL: select /*+read_consistency(weak)*/ tenant_name, tenant_id, stat_id, value from v$sysstat, __all_tenant where stat_id IN (130001, 130004) and (con_id > 1000 or con_id = 1) and __all_tenant.tenant_id = v$sysstat.con_id; sysstat_value takes the value of the value field, and other fields are used as labels |
| Metric to be collected | sysstat_value |
| Monitoring expression | 100 * sum(sysstat_value{metric_group="sysstat",stat_id="130001",@LABELS}) by (@GBLABELS) / sum(sysstat_value{metric_group="sysstat",stat_id="130004",@LABELS}) by (@GBLABELS) |
| Collection interval | 1 second |
Note
- Stat event ID 130001: statistics the total amount of memory used by the tenant.
- Stat event ID 130004: statistics the maximum amount of memory that can be used by the tenant.
The monitoring expression in the table indicates that the ratio of the sum of the value when stat_id is 130001 to the sum of the value when stat_id is 130004 is used as the value of the monitoring metric.
The value of the monitoring metric ob_tenant_host_memstore_percent indicates the memory usage of the tenant in the OceanBase cluster. When the usage exceeds the threshold (which is 85% by default), an alert is generated.
Rule information
Monitoring metric |
Default threshold (unit: %) |
Duration |
Detection interval |
Elimination interval |
|---|---|---|---|---|
| ob_tenant_host_memstore_percent | 85 | 0 seconds | 60 seconds | 5 minutes |
Alert information
Alert trigger method |
Alert level |
Scope |
|---|---|---|
| Based on the monitoring metric expression | Warning | Tenant |
Alert template
Alert summary
- Template: ${alarm_target} ${alarm_name}
- Example: ob_cluster=obcluster-1:tenant_name=tenant-1:svr_ip=xxx.xxx.xxx.xxx OceanBase tenant MemStore usage exceeds the limit
Alert details
- Template: Cluster: ${ob_cluster_name}, Alert: ${alarm_name}. MemStore usage ${value_shown} exceeds ${alarm_threshold} %.
- Example: Cluster: obcluster-1, Alert: OceanBase tenant MemStore usage exceeds the limit. MemStore usage 86.0 % exceeds 85.0 %.
Alert recovery
- Template: Alert: ${alarm_name}, OceanBase tenant MemStore usage: ${value_shown}
- Example: Alert: OceanBase tenant MemStore usage exceeds the limit, OceanBase tenant MemStore usage: 83 %
Impact on the system
When the memory of the tenant is insufficient, SQL execution may slow down or the write may fail.
Possible causes
It is common for the write to be high at a certain time, while the tenant resource configuration is small.
Solution
Try to scale out the tenant's memory after it exceeds the memory quota. You can handle the situation by executing an alert action. For more information, see Alert actions.
Throttle or scale out the tenant based on the troubleshooting results.
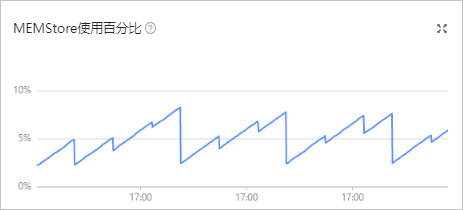
Go to the Performance Monitoring page of the tenant on OCP, and click the Performance and SQL tab.
Set the Time to "1 Week".
View the MEMStore Usage Percentage chart.
Observe whether the memory usage at the time of the alert was abnormally high.
If the memory usage was unusually high, or it rose periodically and was accompanied by alerts each time, especially when resources were insufficient:
You can follow Limit the traffic to an OceanBase cluster to write an SQL hint for this tenant that limits the concurrency for certain SQL types.
If the memory usage showed normal fluctuations or periodic increases and resources were not tight:
You can follow Manage unit specifications to increase the memory size for the tenant's unit specifications.