


This topic describes how to view the details of an SQL statement in OceanBase Cloud Platform (OCP), including its execution status, execution plans, bound indexes, and throttling enabling status.
You can view the details of an SQL statement by using the following methods:
Method 1: Log in to the OCP console. In the left-side navigation pane, click OceanBase Autonomy Service. On the page that appears, find the target cluster and click its name to go to the Real-time Diagnostics page.
Method 2: Log in to the OCP console. On the Overview page of a tenant, click SQL Diagnostics in the left-side navigation pane.
Applicability
OCP Community Edition does not support OceanBase Autonomy Service. To use this service, go to the relevant page by using Method 2.
Prerequisites
To view the details of an SQL statement by using Method 1, make sure that you have the following permissions:
- Resource Permissions: Cluster Read-only or Tenant Read-only permission
- Menu Permissions: Permission on the Real-time Diagnostics menu of OceanBase Autonomy Service
To view the details of an SQL statement by using Method 2, make sure that you have the following permissions:
- Resource Permissions: Cluster Read-only or Tenant Read-only permission
- Menu Permissions: Permission on the SQL Diagnostics menu of Tenants
The version of OceanBase Database is later than 3.0, if you want to view the execution profile of an SQL statement.
Your password box contains the tenant password, if the current tenant is in MySQL mode.
Your password box contains the password of the sys tenant in the cluster, if the current tenant is in Oracle mode.
Note
To bind indexes and plans and configure throttling, you must have the UPDATE privilege on the current tenant.
Go to the details page of an SQL statement
The procedure of Method 1 is described as follows:
In the left-side navigation pane, click OceanBase Autonomy Service. On the Cluster Details page, click the name of the target cluster to go to its Real-time Diagnostics page.
By default, the SQL Diagnostics tab appears.
On the Suspicious SQL, TopSQL, SlowSQL, ParallelSQL, High Risk SQL, or New SQL tab, find the target SQL statement.
You can specify search criteria to find the target SQL statement.
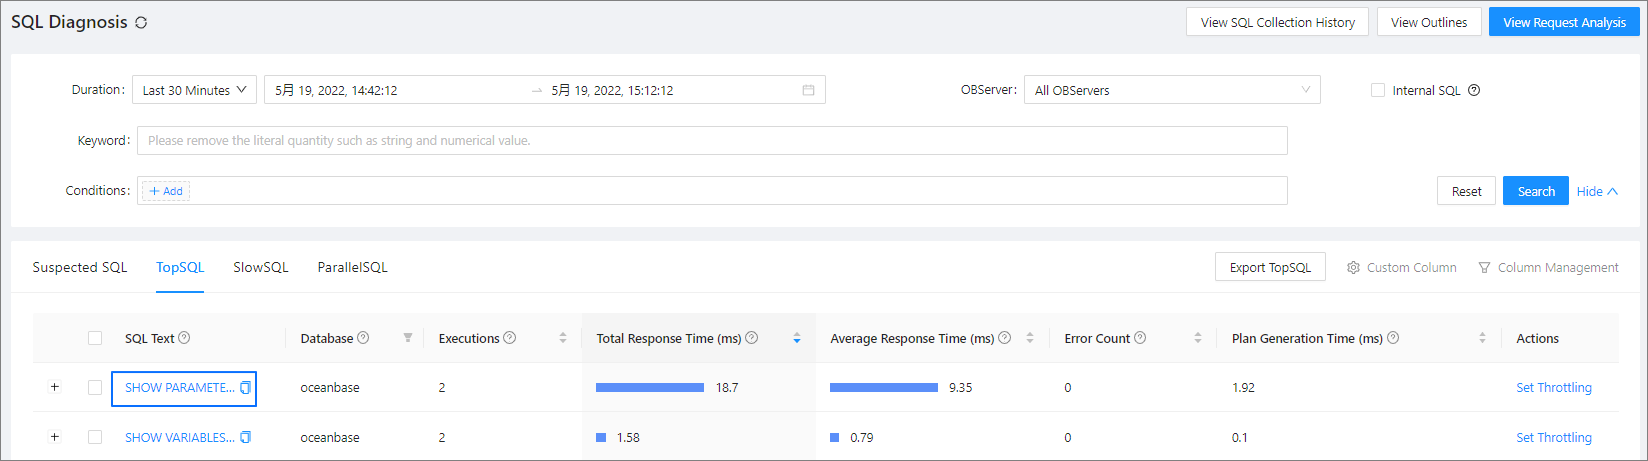
Click the SQL text of the target SQL statement to go to its details page.
On the SQL Details page, you can view the following details of the SQL statement:
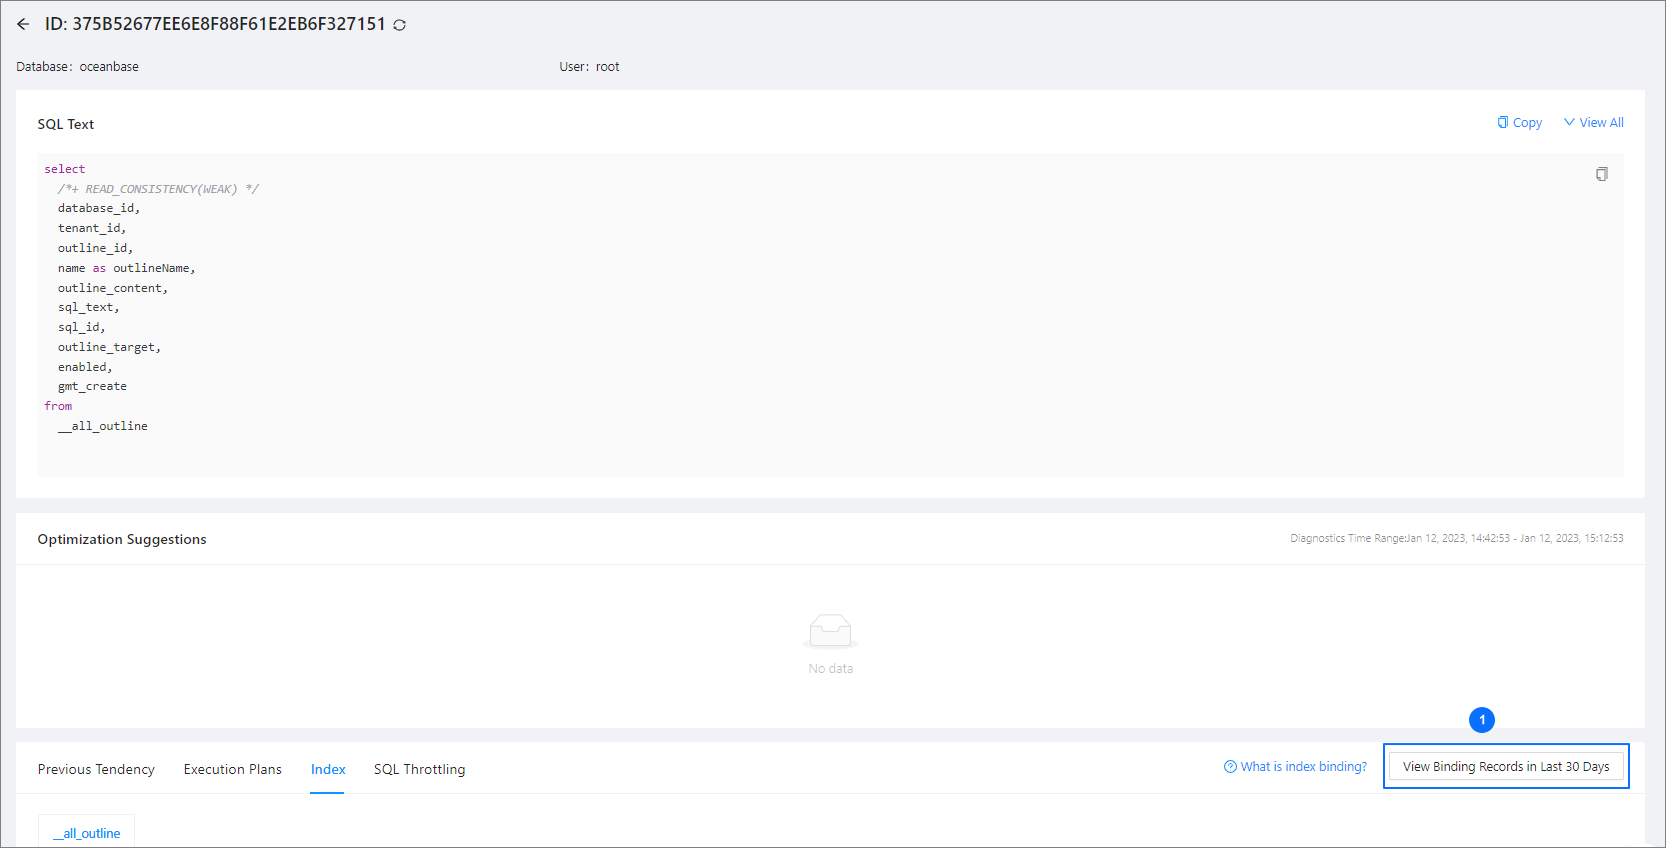
In the SQL Text section, you can view the complete SQL statement. OCP masks sensitive data in the SQL statement. However, if OCP failed to parse the SQL statement, it returns the original SQL statement. You can select Show Schema to show the table creation statement.
In the Optimization Suggestions section, you can view the optimization suggestions for the SQL statement. For more information, see View optimization suggestions.
In the SQL Execution Profile section, you can view the execution details of the SQL statement. For more information, see View the execution profile of the SQL statement.
On the Previous Tendency tab, you can view the historical trends of the SQL statement. For more information, see View the historical trends of the SQL statement.
On the Execution Plans tab, you can view the execution plans of the SQL statement, or bind an execution plan to the statement. For more information, see View the execution plans of the SQL statement.
On the Index tab, you can view the indexes bound to the SQL statement. For more information, see View and bind indexes.
On the SQL Throttling tab, you can view or set throttling for the SQL statement. For more information, see Set throttling for the SQL statement.
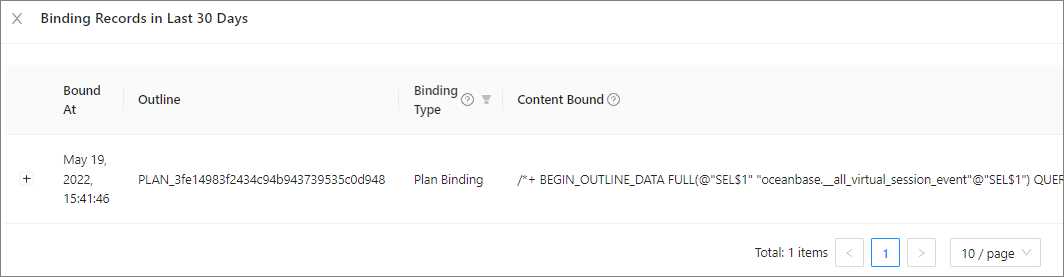
You can view the binding records of the SQL statement in View Binding Records in Last 30 Days on the Execution Plans, Index, and SQL Throttling tabs.
In the binding records, you can view the status of a bound execution plan, or click Unbind to unbind the plan from the SQL statement. You can click Bind Plan to bind the plan to the SQL statement again.
View optimization suggestions
If the SQL diagnostics feature identifies a change in the execution plan or performance of the SQL statement or identifies an excessively long response time of the SQL statement, you can view the problems and solutions in the Optimization Suggestions section. This section provides index recommendation, historical plan recommendation, and CPU capacity scale-out recommendation. You can also view the plan hash and diagnostic details, and bind execution plans.
Index recommendation is provided based on the following algorithm:
The equality query columns are arranged in the front and combined in any order.
If range queries are performed, the range query column with the best selectivity is arranged after the equality query columns.
If no range query is performed, the sorting column is arranged after the equality query columns when the sorting elimination condition is met.
Other columns in the predicate are arranged after the index. In this case, the index is a half-width index.
Other columns in the SELECT statement are arranged after the index to construct a covering index.
If the covering index contains eight or fewer columns, the covering index is recommended. Otherwise, the half-width index is recommended.
Note
Table joins are not supported.
The relevant parameters are described as follows:
ocp.perf.sql.index-advisor-cpu-time-threshold: the threshold of the average CPU time of SQL statements for index recommendation. When the average CPU time of SQL statements is greater than this value, index recommendation is provided.ocp.perf.sql.index-advisor-elapsed-time-threshold: the threshold of the average response time of SQL statements for index recommendation. When the average response time of SQL statements is greater than this value, index recommendation is provided.
Execution plans for the same type of SQL statements executed in the last 7 days are analyzed. The execution plan whose average CPU time is 80% lower than that of others is recommended. A local plan is preferentially recommended. When a local plan is unavailable, a distributed plan is recommended.
If the CPU utilization of the tenant is greater than 60%, the system recommends that you scale out the CPU capacity for the tenant.
Note
You can view the diagnostic details of only suspicious SQL statements.
View the details of an execution plan
Click View Plan Hash. In the dialog box that appears, you can view the details of the execution plan, including the basic information, execution steps, and server execution plans.
Bind an execution plan
Click Bind Execution Plan. In the dialog box that appears, click Bind. Then, refresh the page and click View Binding Records in Last 30 Days to confirm that the execution plan is bound.
View diagnostic details
Click View Diagnostic Details to view the diagnostic details of a suspicious SQL statement.
View the execution profile of the SQL statement
The SQL Execution Profile section displays the operator-level execution details of the SQL statement, including the trace ID, degree of parallelism, request time, response time, and operations.
Note
You can view the execution profiles of only parallel SQL statements.
View details on the Trace Details page
Click a trace ID to go to the Trace Details page and view the execution profile, which displays the basic information of the trace, schema table, schema index, OBServer node details, and operator execution details.
- Click Download Execution Profile Report in the upper-right corner of the page to export the trace information as an HTML file.
- Click the triangular icon next to the trace ID to switch to another trace.
- On the Schema Table tab, click the table creation statement to view the details of the statement.
- On the Schema Index tab, bind or unbind indexes.
Download the execution profile report
In the SQL Execution Profile section, click Download Execution Profile Report in the Actions column of the target trace to export the trace information as an HTML file.
View the historical trends of the SQL statement
On the SQL Details page, click the Previous Tendency tab.
You can view the SQL Statement Execution and SQL Plan Generation Time charts on this tab. If you modify the statistical period in the figure, both charts will be updated based on the new period.
SQL Statement Execution chart
By default, this chart displays Average Response Time, CPU Time, and Execution Time. You can select more metrics to display in Metric Management of the figure.

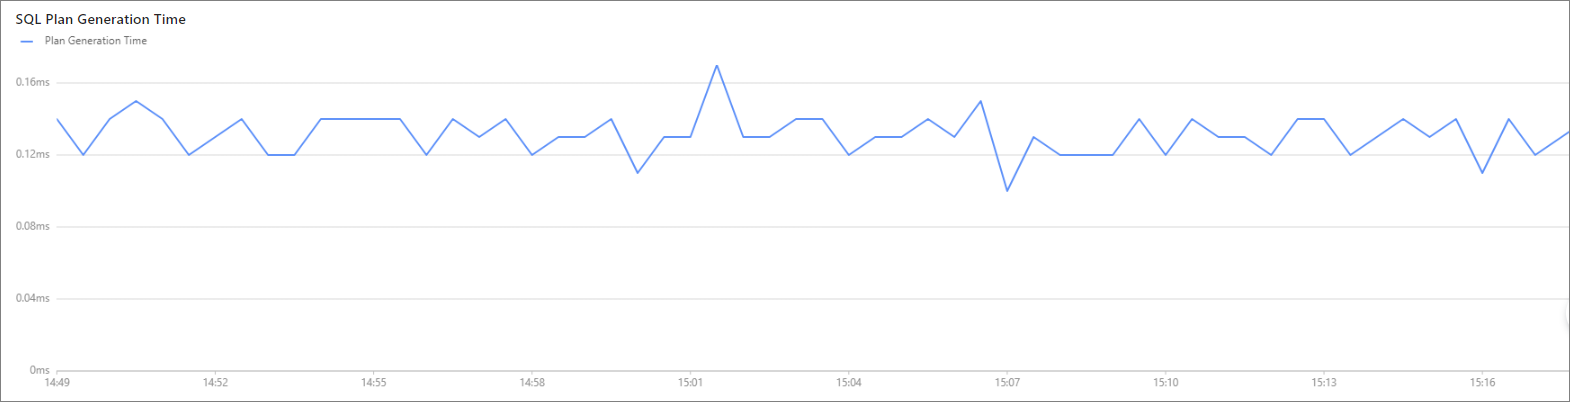
SQL Plan Generation Time chart
This chart indicates the generation of a new plan. The time used to generate the plan is represented by the y-axis.
View the execution plans of the SQL statement
On the SQL Details page, click the Execution Plans tab. On this tab, you can perform the following operations:
Set the range and time window to query in Custom Time.
Click View Binding Records in Last 30 Days to view the execution plan binding records of the SQL statement in the last 30 days.
Click the value in the Plan Hash column to view the details of the execution plan, including basic information, execution steps, and execution records on different OBServer nodes.
Click Bind to bind the execution plan to the SQL statement.

View and bind indexes
On the SQL Details page, click the Index tab. On this tab, you can perform the following operations:
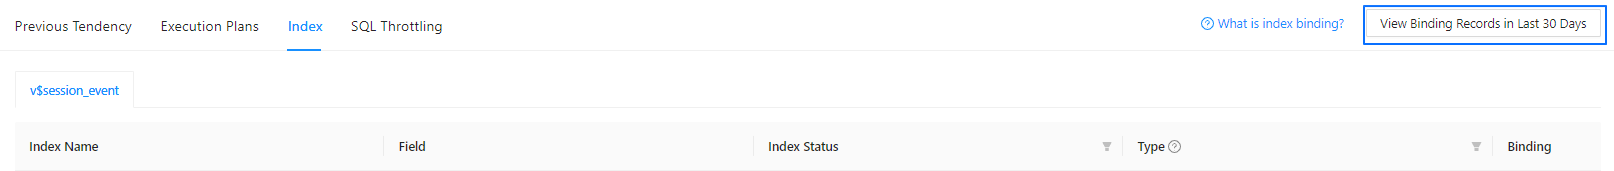
View the list of indexes bound to the SQL statement.
You can filter the indexes by index status and type. You can also click Bind to bind an index to the SQL statement. You can create indexes by using a command-line tool or in OceanBase Developer Center (ODC).
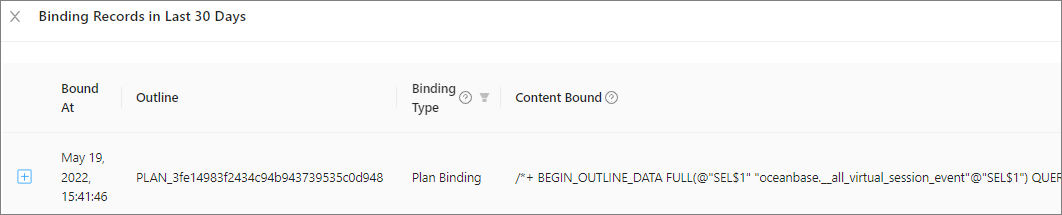
Click View Binding Records in Last 30 Days to view the index binding records of the SQL statement in the last 30 days.
In the binding records, you can view the status of a bound index, or click Unbind to unbind the index from the SQL statement. You can click Bind Index to bind the index to the SQL statement again.
Set throttling for the SQL statement
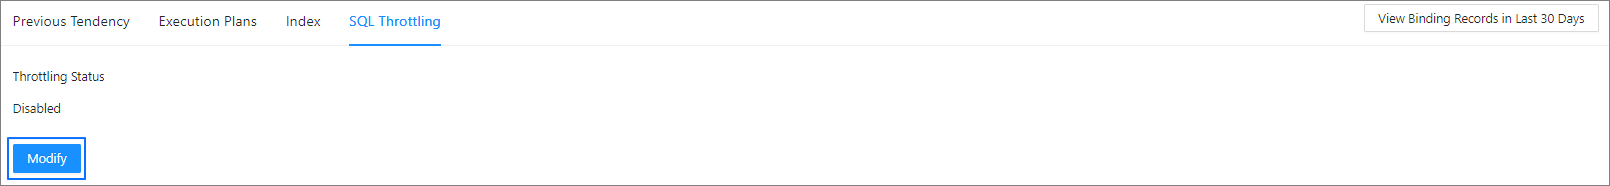
On the SQL Details page, click the SQL Throttling tab. On this tab, you can perform the following operations:
Check whether the current SQL statement is throttled.
The following figure shows that the SQL statement is not throttled.
Set throttling for the current SQL statement.
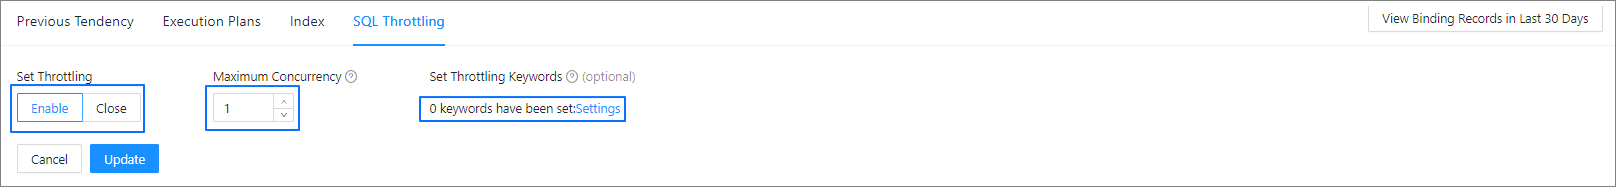
As shown in the preceding figure, enable throttling and specify the throttling strategy.
Maximum Concurrency: The value range is [0,+∞), and 0 indicates that throttling is disabled.
Throttling Keywords: Click Settings. In the Set Throttling Keywords dialog box, specify the throttling keywords in section ① in the figure.
Note
If no keywords are specified, the entire SQL statement is throttled.
If the throttling keywords failed to take effect, you can view the causes in section ② in the figure.
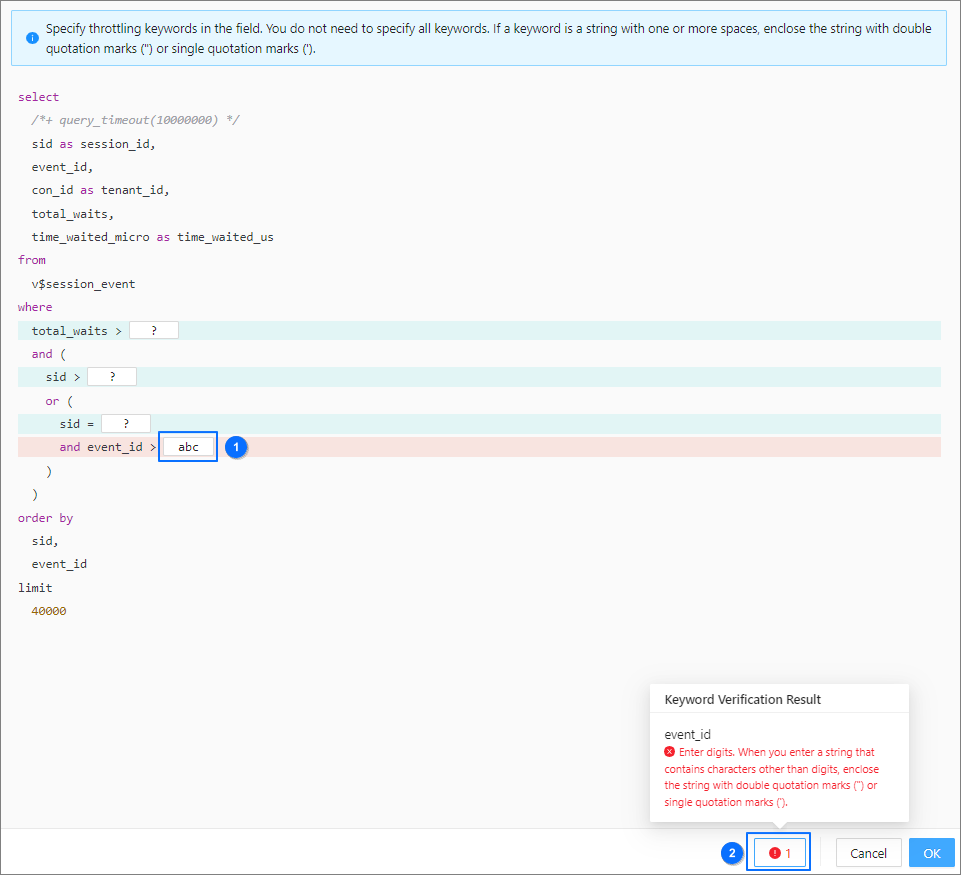
Click Update, and then click OK in the dialog box that appears.