


This topic describes how to generate and view the active sessions history (ASH) report. The ASH report provides you with the SQL statements that use the most database resources during a diagnosis period, the execution details of historical sessions of an OceanBase cluster, and other information. You can optimize the SQL statements based on the information and improve the SQL execution efficiency.
Prerequisite
You have the permissions to manage tenants.
Enter the Session Management page
Log on to the OceanBase Cloud Platform (OCP) console.
In the left-side navigation pane, click Tenants .
Find the target tenant in the Tenants list and click the tenant name.
The Overview page of that tenant automatically appears.
Click Session Management on the left-side to go to the Session page of the tenant.
Generate the ASH report
Click the Active Session History Report tab on the Sessions page.
Click Generate Report .
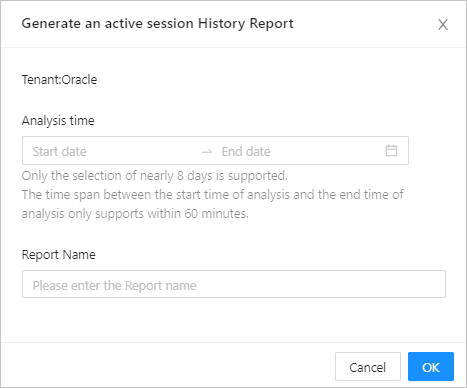
The Generate ASH Report dialog box automatically appears.
Specify Analysis Time and Report Name .
Analysis Time: Specify the start time and end time of the active session analysis.
Report Name: The report name is automatically generated based on the specified time in the following format: OBASH_cluster name_tenant name_start time_end time. You can also customize the report name.
Click OK .
Wait until the report is generated.
View the ASH report
Click the ASH Report tab on the Sessions page.
In the Reports list, enter the name of report or creator in the search box and click the search icon.
The reports that meet the filter conditions are displayed in the Reports list.
View an ASH report
Click View in the Actions column to view the report online.
Click Download in the Actions column to download the report and view it locally.
Report content
You can view the following information in an ASH report:
Basic Information
Parameter Description Basic information of the report The information of data analysis is provided in the following columns: Start Time, End Time, Elapsed Time, Sample Points, and Average Active Sessions. Basic information of the tenant The basic information of the target tenant is provided in the following columns: Tenant Name, Cluster, OceanBase Version, Mode, Replicas, Tenant Creation Time, Replica Distribution, and Primary Zone. Basic information of the tenant resources The information of the tenant resources is provided in the following columns: Zone, OBServer, Unit Resource Configuration, Replica Type, Active MemStore Size Limit (GB), and MemStore Size Limit (GB). Top Wait Events
Top 5 events with the longest wait time are displayed.
Command Types of Top SQLs
Displays TopSQL's SQL Command Type, Unique SQL IDs, Proportion of Response Time (%), and Average Active Sessions.
SQL Statistics
SQL statements sorted by wait time: Top 5 SQL statements with the longest wait time are displayed.
List of full SQL text: The full text of the top 5 SQL statements of the longest wait time is displayed.
Sessions Sorted by Wait Events
Top 5 sessions of the highest wait event activity rate, and top 3 wait events of the longest wait time among these sessions are displayed.
Activity Time Slices
The following information is displayed: the Start Time, End Time, and Duration of all time slices, and the Average Active Sessions, Top 3 Wait Events, Wait Event Activity Rate, and Proportion of Wait Event Time.