


This topic describes how to analyze the requests from clients to OBProxy clusters.
You can query all or failed requests in the last 30 minutes, the last 1 hour, or a custom period of time.
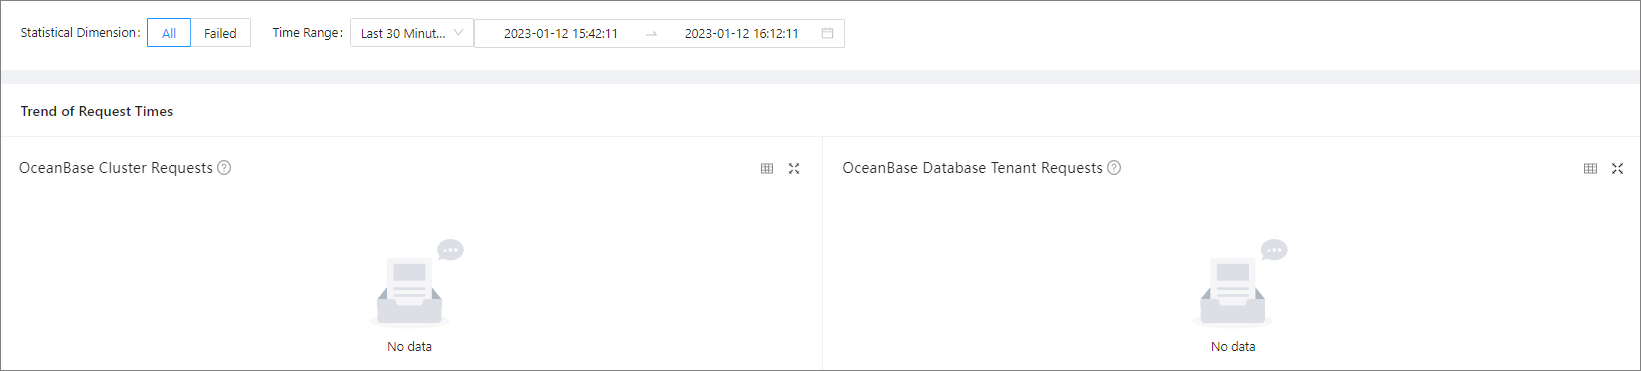
Request trends
You can view the OceanBase cluster request trends and OceanBase Database tenant request trends.
- OceanBase Cluster Requests: This section summarizes the number of requests from clients to OBProxy clusters by cluster.
- OceanBase Database Tenant Requests: This section summarizes the number of requests from clients to OBProxy clusters by tenant.
The following features allow you to view and analyze the request analysis data on a trend chart in a more efficient manner. You can learn about the features with the help of the figure below.
- Filter data:
- View the trend details of a metric over a specific period. To use this feature, drag the pointer over the period to select this period. Then, the system displays the trend details in a zoomed-in view. After you view the trend details, double-click the trend chart to return to normal.
- Hide the data of a submetric. To use this feature, click the icon of the submetric. The submetric will then turn gray and its data will be hidden from the chart.
- View data at a specific point in time. To use this feature, move the pointer over this point in time on the trend chart.
- Zoom in on the trend chart. To use this feature, click the zoom-in icon in the upper-right corner. The preceding features 1, 2, and 3 are also applicable to a zoomed-in chart.
- View the number of requests to all clusters or tenants: Click the
 icon in the upper-right corner of the trend chart.
OBProxy requests
The OBProxy Requests section displays the numbers of OBProxy requests.