


On the Overview page, you can view the core metrics and alerts of backup and restoration, backup storage trends, and information about clusters that have or have not been backed up. You can also go to the corresponding pages to initiate restoration tasks and immediate backup tasks, create backup policies and restoration sampling policies, and launch the backup and restoration wizard.
Core metrics
In the Core Metrics section, you can view Clusters with Backup Policies, Weekly Data Backup Success Rate, Objects with Log Backup Latency , and Weekly Successful Restoration Sampling Tasks .

Alerts
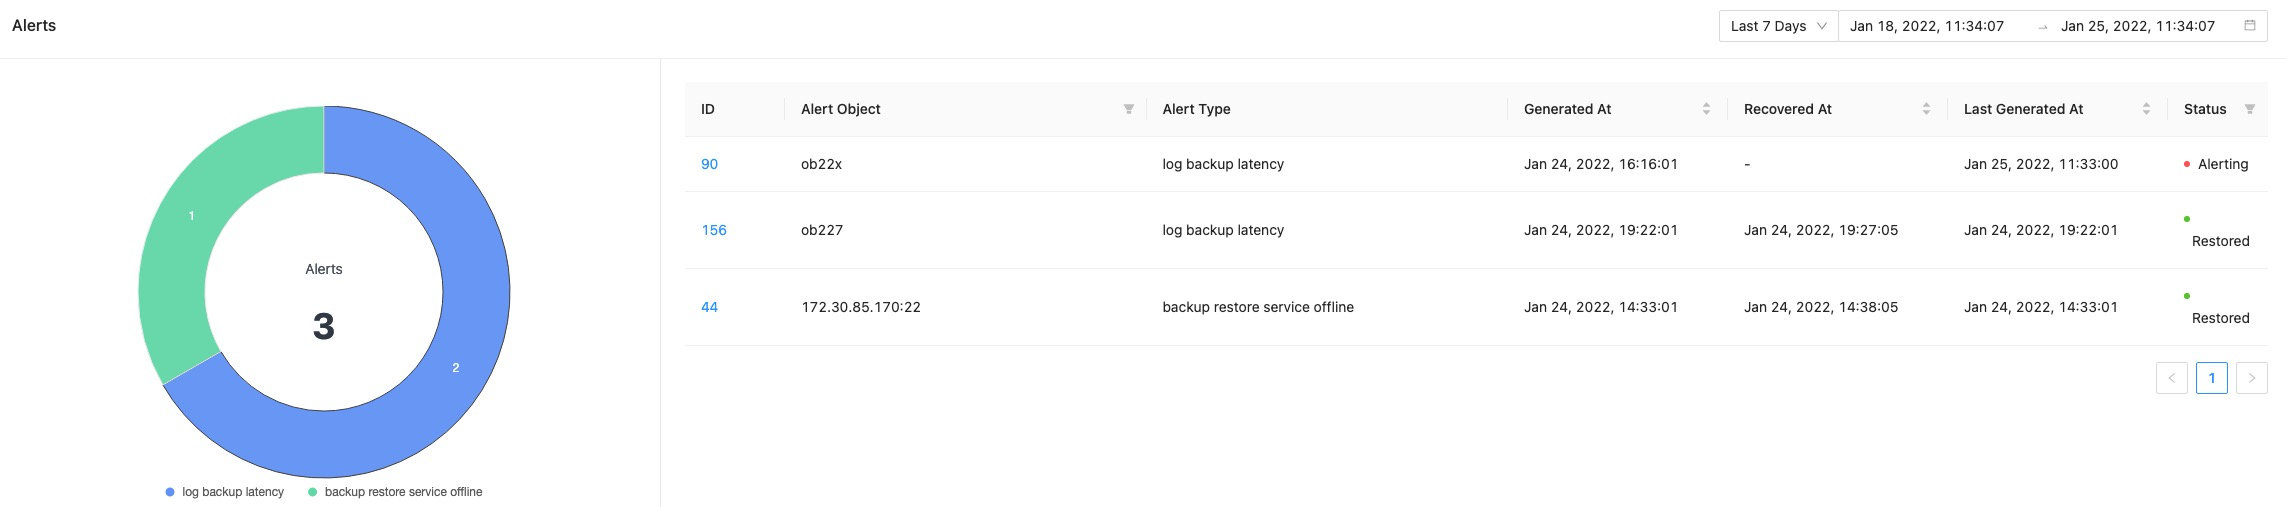
In the Alerts section, you can filter alerts by time range. The total number of alerts in the specified time range is displayed in the ring chart on the left, and the table on the right displays the following information about the alerts: ID, Object, Alert Type, Generated At, Recovered At, Last Generated At , and Status . You can further filter the alerts by status. You can click the ID of an alert to view details of the alert.
Backup storage trends
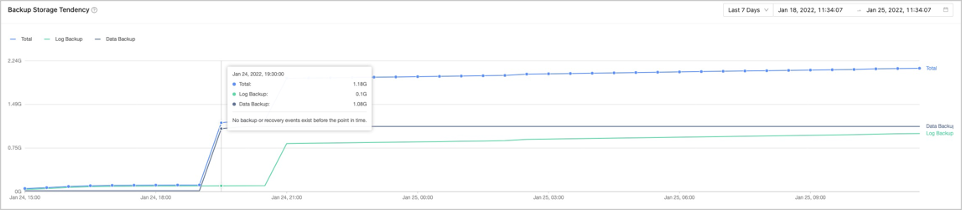
In the Backup Storage Trends section, you can select a time range to view the backup storage trends from the perspective of Total Volume, Data Backup , and Log Backup . You can filter the chart by time or cluster to view the backup storage tendency chart in a specific time range. You can also move the pointer over a specific points in time on the curve to view the backup storage data.
Cluster Backed Up
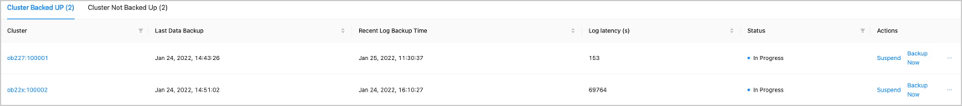
The Clusters Backed Up tab displays the number of backed up clusters in the tab name. The table on this tab contains the following columns: Cluster Name, Last Data Backup, Last Log Backup Time, Log Latency , Status , and Actions .
- When OceanBase is V4.0 and above, display the tenants with backup data and the clusters they belong to (including manual and automatic scheduled backups).
- When OceanBase is below V4.0, display the clusters with backup data (including manual and automatic scheduled backups).
| Parameter | Description |
|---|---|
| Last Data Backup | Indicates the time of the last data backup. |
| Log Latency | Indicates the latency between the log backup data and the real-time data. |
| Status | Valid values: No Backup Strategy , In Progress , Suspend Backup Scheduling Task , Scheduling Exception , and Pending Backup Scheduling . |
| Actions | The following options are available: Pause strategy, Back up Now, and Initiate Recovery . For more information, see Back up now and Initiate restoration. |
Cluster Not Backed Up
The Clusters Not Backed Up tab displays the number of clusters that have not been backed up in the tab name. This tab displays the name of each cluster and provides the Back up Now and Create Backup Policy options for each cluster. For more information, see Back up now and Create a cluster-level backup strategy.
