


SQL execution errors are common in database O&M and can directly impact business operations. There are many reasons why SQL statements may fail to execute, such as unsuccessful database connections, insufficient user privileges, syntax errors, or data that does not meet query conditions.
To help you quickly identify root causes and efficiently resolve issues, the following sections outline a clear and practical process for troubleshooting SQL errors. This process provides specific steps to improve resolution efficiency and minimize business impact, supporting your routine O&M tasks.
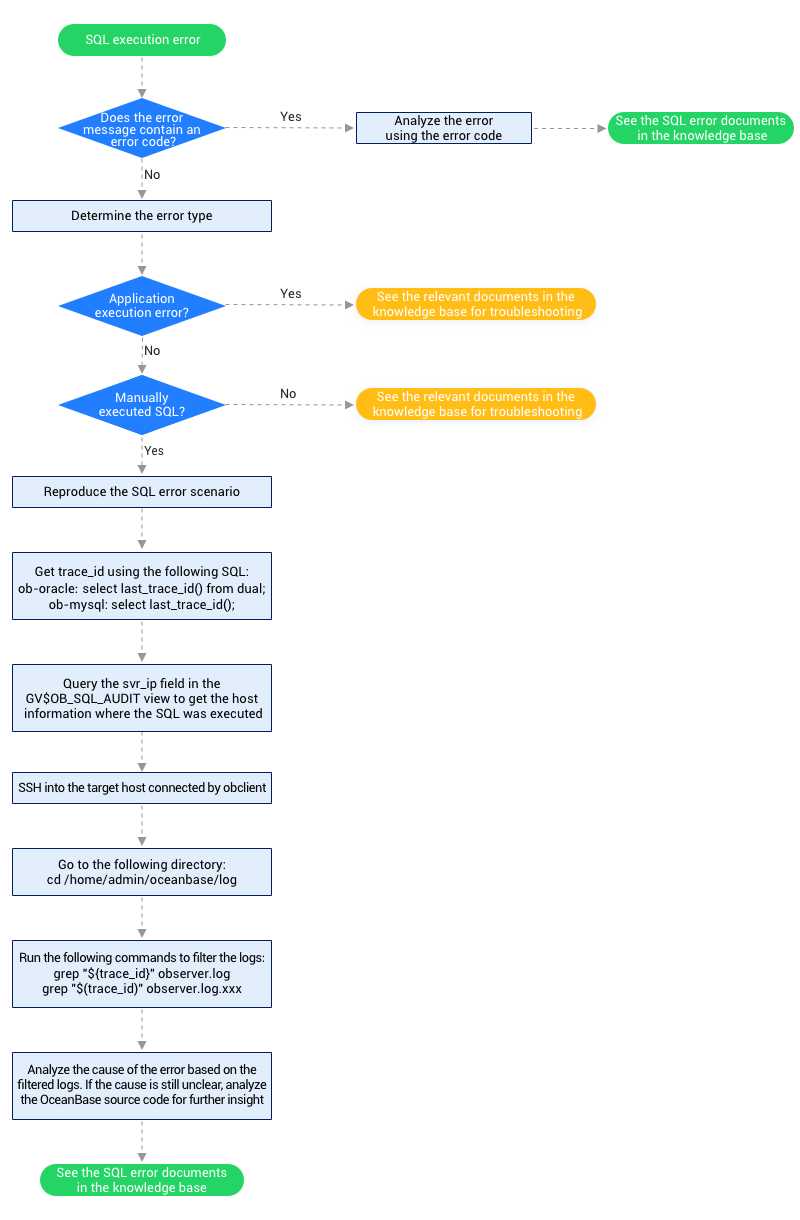
The diagram below illustrates the SQL execution error troubleshooting process.
Process overview
When an SQL execution error occurs, you can troubleshoot the issue by following the procedure below.
After an SQL execution error occurs, check the SQL error message. If the error message contains an error code, troubleshoot the issue based on the error code. If the error message does not contain an error code, determine the error type. The error may be caused by application execution or by manual SQL execution:
If the error is an application execution error, refer to Application exception: error message does not contain an OceanBase error code and Application exception: error message contains an OceanBase error code for troubleshooting methods.
If the error is a manual SQL execution error, determine whether the error can be manually reproduced.
If the error cannot be reproduced, search the Knowledge Base using the SQL statement for reference.
If the error can be reproduced, recreate the error scenario. Connect to the OceanBase cluster through port 2881 or 2883 according to the original scenario, and execute the original SQL statement to reproduce the issue.
After reproducing the SQL execution error, perform the following steps to collect information for troubleshooting:
Execute the following statement to obtain the
trace_id:Notice
You must execute the following statement immediately after the SQL statement that causes the error. Otherwise, the
trace_idobtained will not correspond to the SQL statement that caused the error.MySQL-compatible modeOracle-compatible modeThe statement to obtain the
trace_idin MySQL-compatible mode is:obclient> SELECT last_trace_id();The statement to obtain the
trace_idin Oracle-compatible mode is:obclient> SELECT last_trace_id() FROM DUAL;Use the obtained
trace_idto find the host that executed the SQL statement.OceanBase clusters are typically deployed across multiple nodes. You can execute the following statement to identify the node that executed the SQL statement, and then filter logs on that node.
MySQL-compatible modeOracle-compatible modeExecute the following statement in MySQL-compatible mode:
obclient> SELECT * FROM oceanbase.GV$OB_SQL_AUDIT WHERE trace_id=last_trace_id;Replace
last_trace_idwith thetrace_idobtained in the previous step.Execute the following statement in Oracle-compatible mode:
obclient> SELECT * FROM SYS.GV$OB_SQL_AUDIT WHERE trace_id=last_trace_id;Replace
last_trace_idwith thetrace_idobtained in the previous step.In the query result from the
GV$OB_SQL_AUDITview, the host indicated bysvr_ipis the one that executed the SQL statement.Use the
sshcommand to log in to the host based on the obtained host information.Navigate to the log directory.
The following example assumes that the OceanBase Database installation directory is
/home/admin/oceanbase. The actual log path may vary depending on your environment.cd /home/admin/oceanbase/logExecute the following commands to filter logs:
grep "${trace_id}" observer.loggrep "${trace_id}" observer.log.xxxReplace
${trace_id}with thetrace_idobtained in the previous steps.observer.log.xxxrefers to a log file with a timestamp. Replacexxxwith the actual timestamp corresponding to when the SQL error was reproduced.Analyze the issue using the information provided in the logs, along with the error code or related error messages.
For more information about logs and error codes, see Log overview and Error information overview.
If the log information is unclear, contact technical support for assistance.
Typical cases
The following are typical troubleshooting cases for SQL execution errors.
The database returns an error code after the SQL error is reproduced
- When a
SELECTstatement contains numerousORconditions, manyINconditions connected byAND, or multipleAND NOTconditions, executing the statement may return the error-4013, No memory or reach tenant memory limit.
- When a
The log contains error code information
When processing a
longtextfield in an SQL statement, the errorErrorCode=5098may be returned.An SQL execution error
error 4119 (RPC packet to send too long)may occur, and you can find the messageobrpc packet payload execced its limitinobserver.logby searching with thetrace_id.
Other error messages appear in the log
- When an SQL statement filter includes more than 64 predicates on different fields, the error
-4002 Invalid argumentmay be returned.
- When an SQL statement filter includes more than 64 predicates on different fields, the error
The database returns an error code after the SQL error is reproduced
- For a query involving columns
c1,c2, andc3, wherec1andc2are indexed and multipleINexpressions exist onc1orc2, and any vector expression is formed byc1,c2, andc3, executing the statement may return aninternal errorwith error codeORA-00600.
- For a query involving columns
After SQL execution, an error code is returned and also appears in the log
- Executing an SQL statement may result in a
Timeouterror with error codeORA-00600.
- Executing an SQL statement may result in a