


OceanBase Database V4.0 provides a variety of views. You can obtain the basic information and real-time status of various database objects in an OceanBase cluster by using these views. These views can be classified into two categories: data dictionary views and dynamic performance views.
Data dictionary views
A data dictionary view displays the basic information about database objects that are managed by the
systenant. Typically, the names of data dictionary views begin withDBA_orCDB_. Views whose names begin withDBA_display information about each tenant. For example, theDBA_OB_LSview of a tenant displays the log stream information about the tenant, and theDBA_OB_LSview of thesystenant displays only the log stream information about thesystenant. Views whose names begin withCDB_are used for thesystenant. You can query these views for the status of all tenants in the cluster from thesystenant. For example, theCDB_OB_LSview provides information about all log streams of all tenants in the cluster. In general, each view whose name begins withDBA_has a corresponding view whose name begins withCDB_in thesystenant.Dynamic performance views
A dynamic performance view provides information about the dynamic status changes of the system. Typically, the names of dynamic performance views begin with
GV$orV$. Views whose names begin withV$display only information about the node to which you logged on. Views whose names begin withGV$display information about all nodes. Dynamic performance views of a user tenant display information about the tenant. For example, you can query theGV$OB_UNITSview of a user tenant for the resource unit allocation information about the tenant. Dynamic performance views of thesystenant display information about all tenants in the cluster.
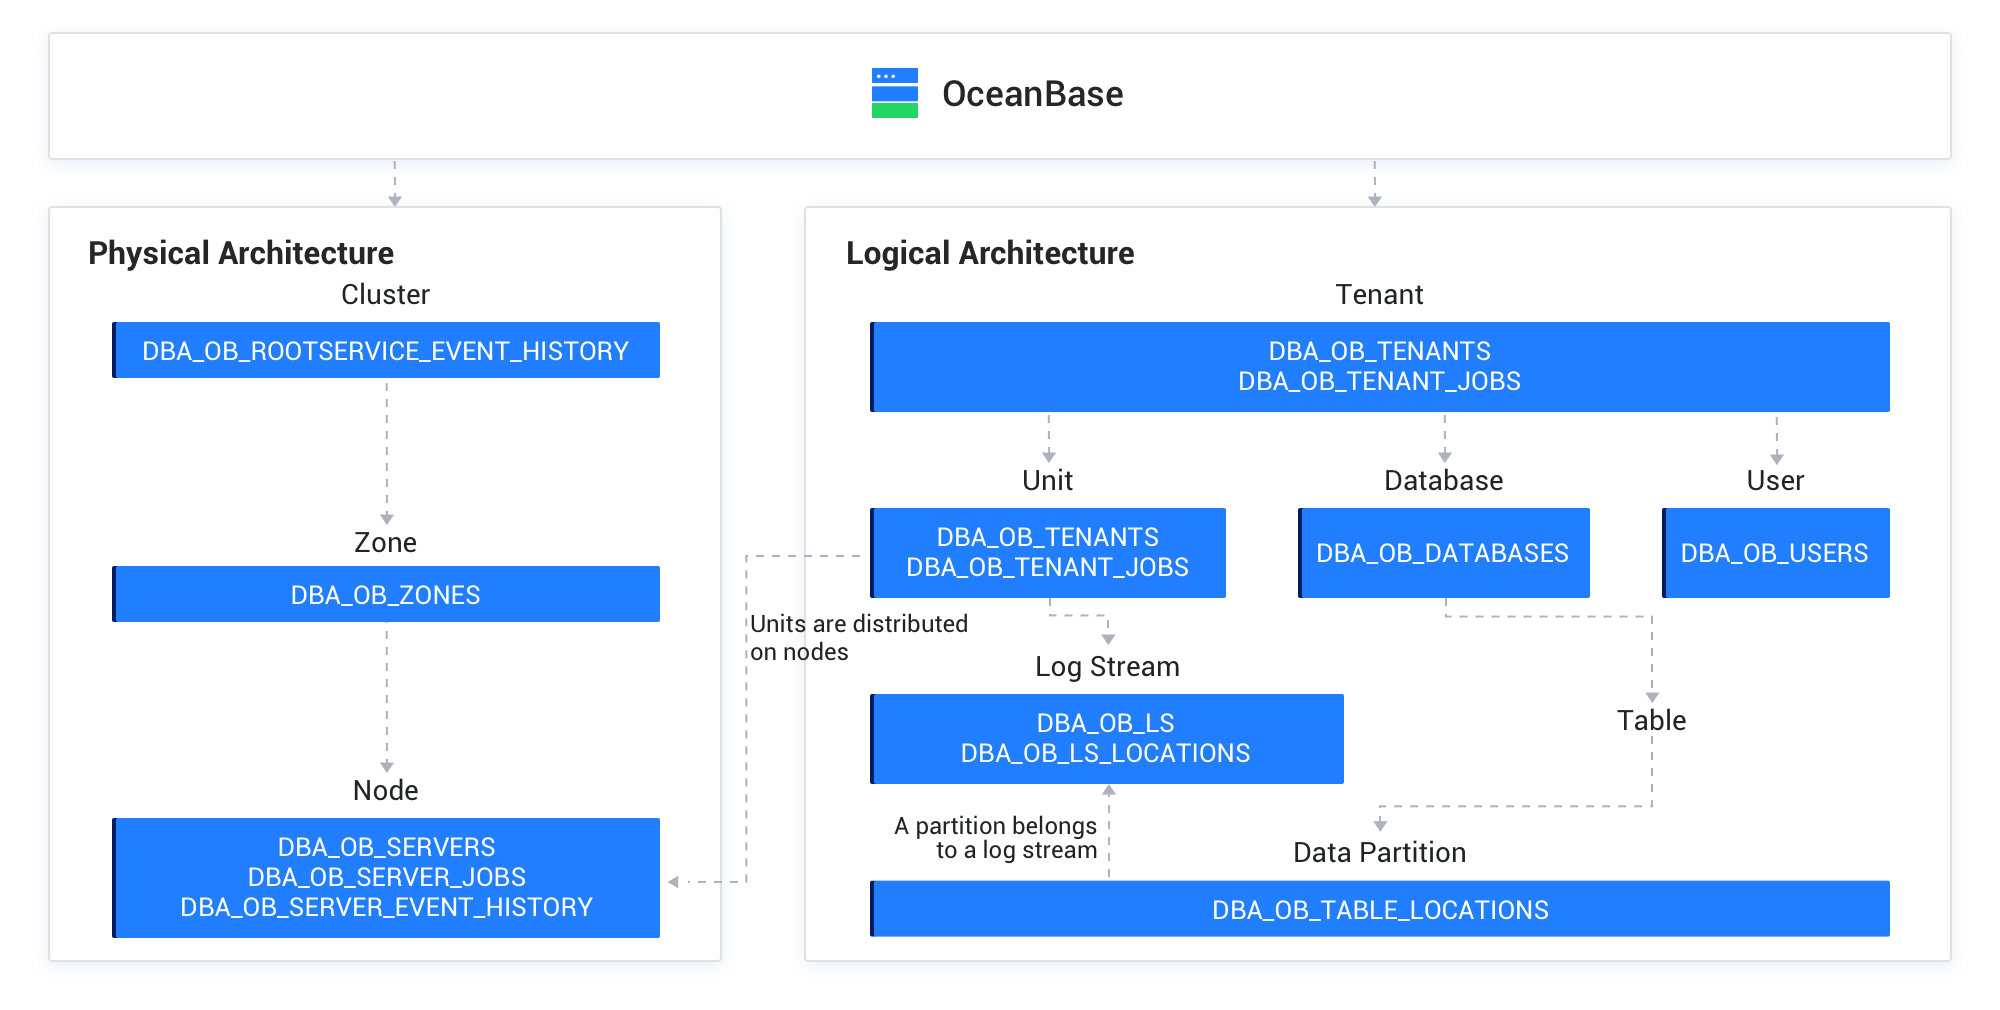
These views show you the internal architecture of OceanBase Database and details about the system operation status. Views allow you to learn about the system components of OceanBase Database, check their status in real time, and understand the relations between them. Internal views are one of the best tools that help you get familiar with OceanBase Database. For example, the following figure shows the data dictionary views for the physical and logical architectures of OceanBase Database, which have been introduced in the previous chapters.
Metric collection
The data sources of metrics are internal dynamic performance views of OceanBase Database. All metrics can be queried by using SQL statements. Dynamic performance views are classified into GV$ views and V$ views. An external monitoring system, such as OceanBase Cloud Platform (OCP), deploys its agent process on each database server and regularly pulls local monitoring information (V$ views) by using SQL APIs. Some global information, such as RootService-related information, is collected from the central node. All monitoring data is reported to the monitoring system database and aggregated by cluster, tenant, node, and resource unit, to display the metrics on the monitoring dashboard.
Note
- Although the data sources of metrics are views of OceanBase Database, we recommend that you use a visual external monitoring system during daily O&M, which makes it easier to analyze the trends of metrics and improves efficiency.
GV$views andV$views are homogenous. Therefore, they are not separately described in the following table. You can query an appropriate view based on the description.
You can view the metrics by logging on to the sys tenant or a user tenant. The names, fields, and user experience of the views in the two types of tenants are the same. The difference is that in a user tenant, you can view only the monitoring information about the current user tenant, but you can view the monitoring information about all tenants in the current cluster from the sys tenant.
In addition to SQL APIs, OceanBase Database allows you to collect metrics by using the Prometheus protocol. This means that you can build a visual monitoring dashboard by using Prometheus and Grafana.
The following table describes the frequently used dynamic performance views of OceanBase Database.
View |
Description |
|---|---|
GV$SYSSTAT |
Displays the system statistics. |
GV$SYSTEM_EVENT |
Displays the statistics of tenant-level wait events. |
GV$SESSION_EVENT |
Displays the statistics of session-level wait events. |
GV$LATCH |
Displays the latch statistics. |
GV$OB_MEMORY |
Displays the memory information. |
GV$OB_PROCESSLIST |
Displays the session information. |
GV$OB_TRANSACTION_PARTICIPANTS |
Displays the information about participants of active transactions. |
GV$OB_SQL_AUDIT |
Displays the SQL statistics. |
GV$SQL_PLAN_MONITOR |
Displays the statistics of SQL operators. |
GV$OB_PLAN_CACHE_STAT |
Displays the plan cache statistics. |
GV$OB_PLAN_CACHE_PLAN_STAT |
Displays the statistics of execution plans. |
GV$OB_PLAN_CACHE_PLAN_EXPLAIN |
Displays the details of execution plans. |
GV$OB_SERVERS |
Displays the information about nodes. |
GV$OB_UNITS |
Displays the information about resource units. |
GV$OB_PARAMETERS |
Displays the information about parameters. |
GV$OB_KVCACHE |
Displays the information about KVCache. |
GV$OB_SSTABLES |
Displays the information about SSTables. |
GV$OB_MEMSTORE |
Displays the information about MemStores. |
GV$OB_LOG_STAT |
Displays the information about log streams. |
Metric classification
Metrics can be classified by different attributes.
Metrics are classified into system and SQL metrics based on the metric type. System metrics describe the system operating status for you to determine the health condition of clusters, tenants, and sessions. System metrics can be further classified into metrics, wait events, and latch events. SQL metrics describe SQL-related monitoring information and record resource consumption and wait events during the SQL execution so that you can diagnose the issue of a specific SQL statement.
Metrics are classified into tenant-level and session-level metrics based on the monitoring granularity. Tenant-level metrics are indexed by tenant ID and node IP address. The external monitoring system regularly collects monitoring data gathered by tenant on each server, and aggregate and display the data by different dimensions, such as cluster, tenant, node, and resource unit, as needed in various scenarios. Tenant-level monitoring provides the data sources of the monitoring dashboard. Session-level metrics are indexed by session ID and trace ID. This allows you to perform end-to-end tracing on specific sessions. Session-level monitoring plays an important role in end-to-end tracing.
Metrics can also be classified based on the monitored objects. For example, the metrics can be classified into categories such as transaction, KVCache, clog, storage, resource, SSTable, and MemStore metrics. With the help of all the metrics of OceanBase Database, you can perform drill-down analysis to find the root causes during fault diagnosis, track the health status of each component in real time to identify potential risks at the earliest opportunity, and prevent the database performance specified in the service level agreement (SLA) from being affected.