


This topic provides an in-depth analysis of performance issues encountered by OceanBase Database during Sysbench testing. By identifying bottlenecks, optimizing configurations, and fine-tuning performance, it offers solutions to enhance the database's stability and efficiency in high-concurrency scenarios. Additionally, it includes case studies of performance issues as references to help users address potential challenges.
Quick troubleshooting of Sysbench issues
If Sysbench shows low or fluctuating TPS, a sudden drop to zero, or unexpected termination, it's important to prioritize quick troubleshooting methods to pinpoint the cause.
Issue 1: Sysbench TPS is lower than expected
To troubleshoot this issue, follow these steps:
Analyze Sysbench parameters.
Start by reviewing the parameters used in the Sysbench command.
If
--rand-type=specialis set or the--rand-typeparameter is not set, set it to--rand-type=uniformto reduce lock contention between data.If the number or size of tables is too small, increase the dataset size, for example,
tables=100,table_size=1000000.If
read_writeorwrite_onlyscenario, check whether there is a deadlock to verify the setup:SELECT * FROM oceanbase.cdb_ob_deadlock_event_history ORDER BY create_time DESC LIMIT 10;
Confirm the connection method.
- If the primary zone is a single zone and you are directly connected to the OBServer node, confirm whether you are connected to the leader replica.
- If the primary zone is random, you must connect to an OBProxy node for testing.
Query the tenant information.
SELECT * FROM oceanbase.dba_ob_tenants;Query the tenant leader.
SELECT svr_ip, sql_port, count(1) FROM oceanbase.cdb_ob_ls_locations WHERE tenant_id=1 AND role='leader' GROUP BY svr_ip;
Observe the CPU overhead.
If there is no issue with the Sysbench parameters and the client connection method, you can observe the CPU usage to further pinpoint the issue.
Observe the CPU usage of threads.
top -H -p pidof observerIf each business thread is nearly utilizing one core, continue to check whether the total number of threads is close to the number of cores of the machine.
- If the number of business threads (for example, T1002_L0_G2) is much lower than the number of cores of the machine and the total CPU overhead is far from reaching the upper limit of the machine, you can conclude that
cpu_countis allocated too few. In this case, check the create tenant command and confirm whethercpu_countis set to a sufficiently high value. - If the total CPU overhead is close to the upper limit of the machine, the performance of the machine has reached its limit. To achieve higher performance, you can use a machine with a higher configuration.
- If the number of business threads (for example, T1002_L0_G2) is much lower than the number of cores of the machine and the total CPU overhead is far from reaching the upper limit of the machine, you can conclude that
Observe the tenant specifications.
show create tenant xxx; SELECT * FROM oceanbase.dba_ob_resource_pools; SELECT * FROM oceanbase.dba_ob_units;If each business thread is not utilizing a core (CPU utilization is 20% to 50%), a bottleneck may exist in another area.
- If a network thread (such as RpcIO) is utilizing a core, the number of network threads may be too small, causing a bottleneck in network communication. In this case, you can increase the value of the
net_thread_countparameter. - If the CPU utilization of all threads is not high, the bottleneck may be in hardware. In this case, you need to further analyze the issue.
- If a network thread (such as RpcIO) is utilizing a core, the number of network threads may be too small, causing a bottleneck in network communication. In this case, you can increase the value of the
Analyze the hardware causes.
After excluding the CPU factor, the remaining hardware causes are mainly due to disk and network issues. To troubleshoot disk and network issues, follow these steps.
- Check the bandwidth of the network card and observe whether the network bandwidth is a bottleneck during the test (you can deploy Sysbench on the OBServer node for testing).
- Check the network latency (ping). High latency can also slow down SQL execution.
- Check the upper bandwidth of the log disk for 16K writes (through FIO test). Observe whether the disk I/O is a bottleneck during the test (you can replace the network card or use an SSD or NVM to test).
The command to view network I/O is:
sar -n DEV 1The command to check the bandwidth of the network card is:
## (eth0 is the name of the network card) ethtool eth0Other possible causes.
Apart from the preceding factors, there may be some special cases, such as conflicts between the test period and background tasks of observer.
One user conducted a business test and found that the TPS of two groups was significantly lower than expected. After checking various configurations, he did not find any obvious problem. Finally, it was discovered that he conducted the test at 2 a.m. Every day at this time, OceanBase Database performed a default daily minor compaction. Therefore, the performance of the database was greatly affected.
Issue 2: Fluctuating or zero TPS in sysbench
If the Sysbench TPS fluctuates or drops to 0, one of the following situations may be present.
TPS fluctuates slightly sometimes
Possible cause: OceanBase Database regularly performs minor compactions, which occupies CPU resources and affects business threads. The impact is lower with a higher value of
cpu_count. For example, during a minor compaction, the TPS of a tenant with 4 CPU cores and 8 GB of memory may drop by 80%; that of a tenant with 32 CPU cores and 64 GB of memory may drop by 10%.Try the following methods:
Increase the value of the
max_cpuparameter for the tenant resource unit.Increase the CPU concurrency of the tenant.
alter system set cpu_quota_concurrency=4 tenant = xxx;Reduce the number of threads for minor compaction (
merge_thread_count) or lower the thread priority (compaction_high_thread_score,compaction_mid_thread_score,compaction_low_thread_score) to reduce the overheads of minor compaction per unit time, but at the cost of increased total minor compaction time.
TPS drops to 0 for a short period of time and then intermittently recovers
- Possible cause: A deadlock occurred, and Sysbench was configured with
--mysql-ignore-errors=1062,1213,6002; - Solution:
Check whether a deadlock has occurred.
SELECT * FROM oceanbase.cdb_ob_deadlock_event_history ORDER BY create_time DESC LIMIT 10;Proceed with the operation after confirmation.
- Add the
--rand-type=uniformparameter to Sysbench. - Increase the size of the dataset: for example,
tables=100,table_size=1000000;(table_sizedefaults to 10000).
- Add the
TPS drops to 0 and remains low
- Possible cause: A deadlock occurred, but it was not detected. The timeout period is set to a very long time, causing the TPS to drop to 0 without an error being reported, the program exiting, or the system recovering.
- Solution:
Check whether a deadlock occurs.
SELECT * FROM oceanbase.cdb_ob_deadlock_event_history ORDER BY create_time DESC LIMIT 10;Proceed with the operation after confirmation.
- Add the
--rand-type=uniformparameter to Sysbench. - Increase the size of the dataset: for example,
tables=100,table_size=1000000;(table_sizedefaults to 10000).
- Add the
TPS drops to 0 but quickly recovers
Possible cause: The clog is full and cannot write data. As a result, the TPS drops to 0. After the clog recycles the space, the TPS returns to normal.
Solution: Check the disk space usage of the tenant:
SELECT tenant_id, svr_ip, svr_port, log_disk_in_use, log_disk_size FROM oceanbase.gv$ob_units;Consider allocating more disk space.
If the problem persists after excluding the preceding causes, contact technical support for further troubleshooting.
Issue 3: Sysbench exits unexpectedly or returns errors
TPS drops to 0 for a short time and then intermittently recovers. Occasionally, it returns error 6002 or 1213.
- Possible cause: A deadlock occurs, the dataset is small, or the
rand-typeparameter is not set. The default special type causes key comparison concentration. Since most SQL statements are still in the deadlock, the threads are waiting for the SQL execution to finish. Therefore, the program does not exit. - Solution:
Check whether a deadlock occurs.
SELECT * FROM oceanbase.cdb_ob_deadlock_event_history ORDER BY create_time DESC LIMIT 10;If a deadlock is identified, perform the following steps.
- Add the
--rand-type=uniformparameter to Sysbench. - Increase the dataset size: for example, set
tables=100,table_size=1000000;. (table_sizedefault value is 10000).
- Add the
Sysbench exits unexpectedly with error 1062
- Possible cause: Error 1062 indicates a conflict with the primary key or unique index. Since Sysbench randomly generates data, there may be a primary key conflict.
- Solution: Add the
--mysql-ignore-errors=1062parameter to Sysbench.
Sysbench exits unexpectedly with error 1213
- Possible cause: A deadlock occurs and some transactions are rolled back.
- Solution: Deadlocks may occur even if a large dataset is used and the
--rand-type=uniformparameter is set. In this case, you can use the--mysql-ignore-errors=1062,1213parameter to ignore deadlock errors.
Sysbench exits unexpectedly with error 6002
- Possible cause: Error 6002 is also caused by a deadlock, but the 1213 error code is not returned and the 6002 error code is returned instead.
- Solution: Increase the dataset size and add the
--rand-type=uniformparameter to reduce lock conflicts. Add the following parameters to Sysbench:--mysql-ignore-errors=1062,1213,6002.
Sysbench exits unexpectedly with error 4012
Possible cause: Severe lock competition, a deadlock, or poor performance of the OBServer node or high client pressure, which causes a timeout.
Solution: Increase the timeout period (in μs):
set global ob_query_timeout = 50000000000;
Sysbench exits unexpectedly with error 5930
Possible cause: The SQL precompilation feature, namely, the
--db-ps-mode=auto, is enabled, but OceanBase Database does not support precompilation.Solution:
- Increase the tenant parameter:
alter system set open_cursors=65535;. - Alternatively, you can disable SQL precompilation and try again:
--db-ps-mode=disable;.
- Increase the tenant parameter:
Sysbench exits unexpectedly with other errors
- Possible cause: This may be a bug in OceanBase Database.
- Solution: Record the error logs and contact the technical support team for help.
General troubleshooting procedure for sysbench issues
If you cannot identify the cause while using the quick troubleshooting method, you can perform a complete check. If you encounter anything that you do not understand during the process, you can view the corresponding chapter or topic in this topic for more information. If the problem still cannot be resolved, contact technical support personnel for further assistance.
Conventional analysis approach:
- Check the hardware resources. Insufficient CPU, memory, or disk resources directly affect performance, and TPS can drop to 0.
- Check the tenant configurations. The tenant has been allocated insufficient resources, so the hardware resources are not fully utilized.
- View the Sysbench parameters. The number of threads directly affects the TPS. A small dataset or data distribution that is too concentrated will cause lock competition or deadlocks.
- Finally, check whether the OBServer node has any bugs.
Note
You can execute the commands as needed. You do not need to execute all of them.
Hardware check
Insufficient CPU or memory resources (less than 4 CPU cores and 8 GB of memory) result in poor performance. A nearly full disk also slows down write speed. High network latency can also affect performance.
- CPU:
lscpu - Memory:
topandcat /proc/meminfo - Disk:
df -h - Network latency:
ping ip
Check the deployment configuration of OceanBase Database
If the hardware resources are sufficient, OceanBase Database may perform poorly if the parameters specified during deployment are small and fail to fully utilize the resources. Most parameters can be dynamically adjusted. However, a few parameters can be specified only during deployment.
Connect to the SYS tenant and query global views.
SELECT * FROM GV$OB_SERVERS;View the number of network threads (you cannot modify this parameter dynamically).
show parameters where name = 'net_thread_count';View the deployed clusters.
obd cluster listView the configurations of the deployed clusters.
obd cluster edit-config [cluster name]
Check the startup parameters of the OBServer process on the OBServer node.
ps -ef | grep observer
Check the tenant configurations
If the resources on the OBServer node are sufficient, you can check whether the resources of the tenant are sufficient by using the following commands.
View the basic information of the tenant.
SELECT * FROM oceanbase.dba_ob_tenants;View the commands for creating the tenant.
show create tenant [tenant name];View the resource pool corresponding to the tenant (you can add
tenant_idas a filter condition).SELECT * FROM oceanbase.dba_ob_resource_pools;View the configuration of the unit corresponding to the tenant.
SELECT * FROM oceanbase.dba_ob_units;
Check sysbench parameters
The Sysbench parameters are included in the Sysbench execution command and can be checked one by one against the parameter descriptions.
Locate a deadlock
Query the deadlock records.
SELECT * FROM oceanbase.cdb_ob_deadlock_event_history ORDER BY create_time DESC LIMIT 10;In the query result, transactions with the
role=victimattribute are killed.Query the SQL statements of transactions.
SELECT usec_to_time(REQUEST_TIME), TRACE_ID, TX_ID, QUERY_SQL FROM gv$ob_sql_audit WHERE TX_ID=52635 ORDER BY REQUEST_TIME;If no relevant transaction is found, the SQL Audit feature is not enabled. In this case, check whether the
enable_sql_auditparameter is set to True:show parameters where name = 'enable_sql_audit';If the query result shows that the parameter is set to False, you cannot view the SQL statements of the transaction. In this case, you can search for the transaction ID in logs to obtain some information.
Query logs of SQL statements.
After you find the SQL statement related to the transaction, search for the trace ID of the conflicting SQL statement in the logs:
grep '[trace id]' observer.log*You can view all logs of the SQL statement. The last log usually contains the error code returned to the client:
sending error packet(err=-4101You can also search for the trace ID of the last
commitorbeginstatement to obtain relevant logs:sending error packet(err=-6002If no logs are found, the log level is incorrect or the log traffic is throttled. In this case, set the log level to
WDIAGand increase the log bandwidth limit:alter system set syslog_level='WDIAG'; alter system set syslog_io_bandwidth_limit='2G';Notice
Deadlocks that occurred before the configuration change cannot be located.
Analyze minor/major compaction issues
View the details of major compactions that took more than 5s.
SELECT * FROM GV$OB_MERGE_INFO WHERE tenant_id=1002 AND (END_TIME-START_TIME)>5 LIMIT 10;View the major compaction records of a table.
SELECT * FROM GV$OB_TABLET_COMPACTION_HISTORY WHERE TABLET_ID IN (SELECT TABLET_ID FROM oceanbase.CDB_OB_TABLE_LOCATIONS WHERE TABLE_NAME = 'sbtest1') ORDER BY START_TIME DESC;Manually trigger a minor compaction.
alter system minor freeze tenant=xxx;
You can also execute the top -H command on the OBServer node to observe the overhead of the MINI_MERGE and MINOR_EXE threads. However, the duration is short.
Slow SQL queries
Query all information about slow SQL queries whose execution time exceeds 5s.
SELECT * FROM gv$ob_sql_audit WHERE elapsed_time > 5000000 LIMIT 10;Customized query to print key information.
SELECT SVR_IP, SVR_PORT, SQL_EXEC_ID, TRACE_ID, TENANT_ID, SQL_ID, QUERY_SQL, PLAN_ID, PARTITION_CNT, IS_INNER_SQL, ELAPSED_TIME, EXECUTE_TIME, APPLICATION_WAIT_TIME FROM gv$ob_sql_audit WHERE elapsed_time > 5000000 ORDER BY elapsed_time DESC LIMIT 10;If no data is found, make sure that the SQL Audit feature is enabled:
show parameters where name = 'enable_sql_audit'; alter system set enable_sql_audit = true;
Troubleshooting log issues
Check the disk space usage.
SELECT tenant_id, svr_ip, svr_port, LOG_DISK_IN_USE, LOG_DISK_SIZE FROM gv$ob_units;
Reproducing the issue
First, clear the existing
sql_auditrecords.alter system set enable_sql_audit = false; alter system flush sql audit global;Enable the
sql_auditlog.alter system set enable_sql_audit = true;Modify the log level.
alter system set syslog_level='WDIAG';Set the SQL record threshold to a smaller value to record more SQL statements.
alter system set trace_log_slow_query_watermark = '10ms';Increase the system log bandwidth limit to prevent key logs from being lost due to throttling.
alter system set syslog_io_bandwidth_limit='2G';If you do not want transactions to time out, you can also increase the timeout period.
set global ob_query_timeout = 50000000000;
After these settings, start Sysbench with the same parameters as the problem scenario.
Analyze and resolve a sysbench performance issue
Analyze and resolve the issue of TPS dropping to 0 and occasional errors in sysbench.
Symptoms
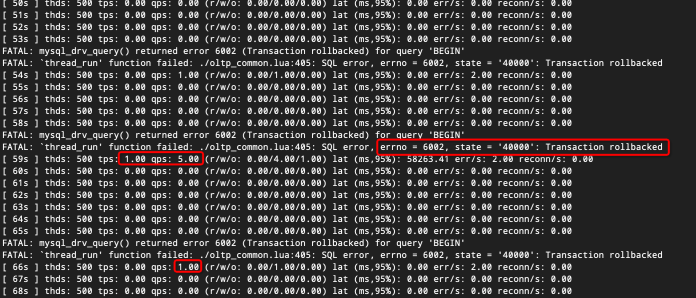
When you run the following command to perform a sysbench test with OceanBase Database Community Edition V4.1.0, the TPS drops to 0 and an error is returned.
sysbench --db-driver=mysql --threads=500 --time=300000 --mysql-host=xxxxxxx --mysql-port=2883 --mysql-user='tpcc@t1' --mysql-password='******' --report-interval=2 --tables=100 /usr/share/sysbench/oltp_read_write.lua --db-ps-mode=disable run
Cause and analysis
The issue is initially suspected to be caused by a small table_size value and the default special data distribution mode, which results in data concentration, severe primary key conflicts, and ultimately a deadlock. The TPS drops to 0.
First, increase the tenant timeout settings.
set global ob_query_timeout = 50000000000; set global ob_trx_timeout = 50000000000;To reproduce the issue quickly, set
Tablesto 1 while keeping other parameters unchanged.sysbench oltp_read_write.lua --mysql-host=[ip] --mysql-port=2881 --mysql-user=root@user --mysql-db=test --table_size=10000 --tables=1 --threads=500 --time=3600 --report-interval=1 --db-ps-mode=disable runObserved phenomenon: TPS drops to 0, but occasionally TPS and QPS are greater than 0.
Check the deadlock view.
SELECT * FROM oceanbase.CDB_OB_DEADLOCK_EVENT_HISTORY ORDER BY create_time DESC LIMIT 10;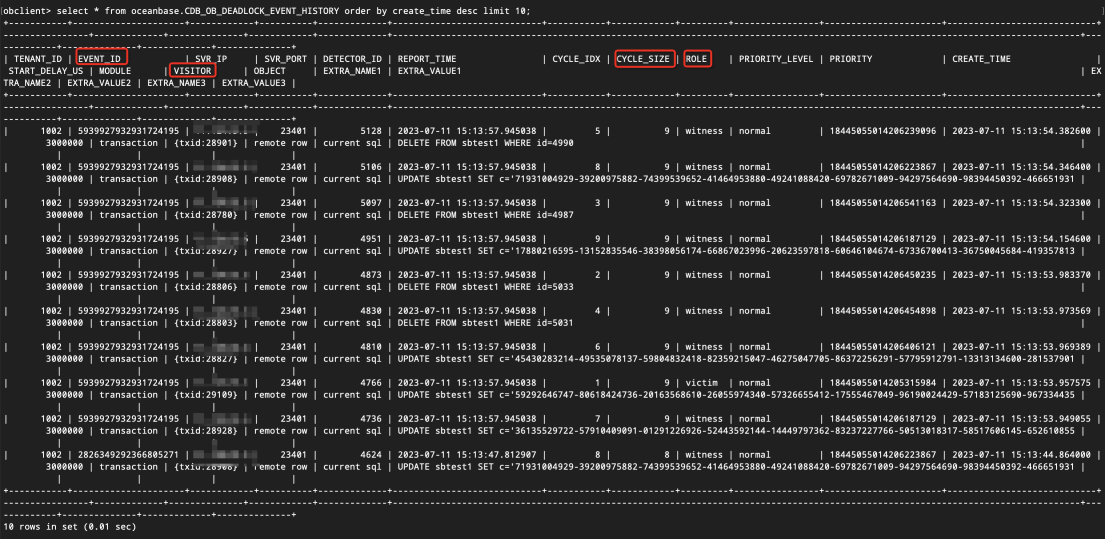
You can see the latest deadlock record in the query result. A
role=victimtransaction is the deadlocked transaction that is terminated, while arole=witnesstransaction is a transaction that witnesses the conflict but is not terminated. Ifcycle_size=2, it indicates that only two transactions are involved in the conflict. Ifcycle_size>2, it indicates that multiple transactions are involved in the conflict. To facilitate observation, select an event withcycle_size=2. You can filter a pair of conflicting transactions byevent_id.SELECT * FROM oceanbase.CDB_OB_DEADLOCK_EVENT_HISTORY WHERE cycle_size=2 ORDER BY create_time DESC LIMIT 10;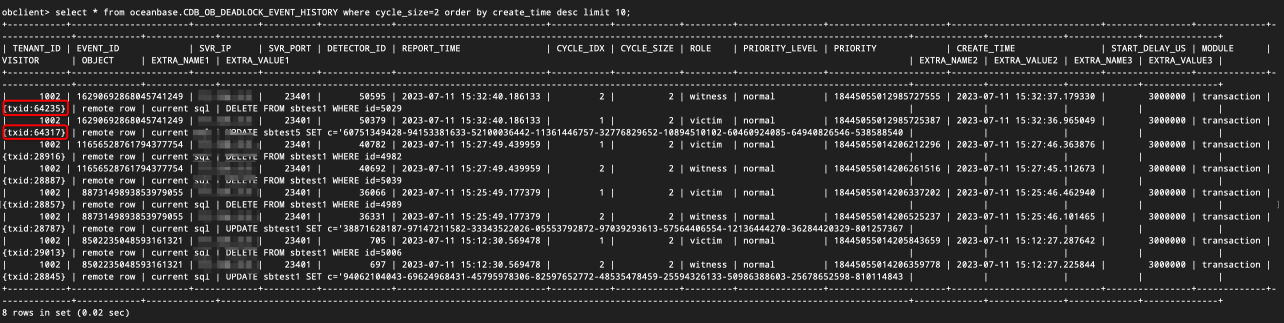
Transaction IDs are included in the visitor field of the query result. You can find all SQL commands related to a transaction by its ID:
SELECT TRACE_ID, TX_ID, QUERY_SQL FROM gv$ob_sql_audit WHERE TX_ID=5042912 ORDER BY REQUEST_TIME; SELECT TRACE_ID, TX_ID, QUERY_SQL FROM gv$ob_sql_audit WHERE TX_ID=5042591 ORDER BY REQUEST_TIME;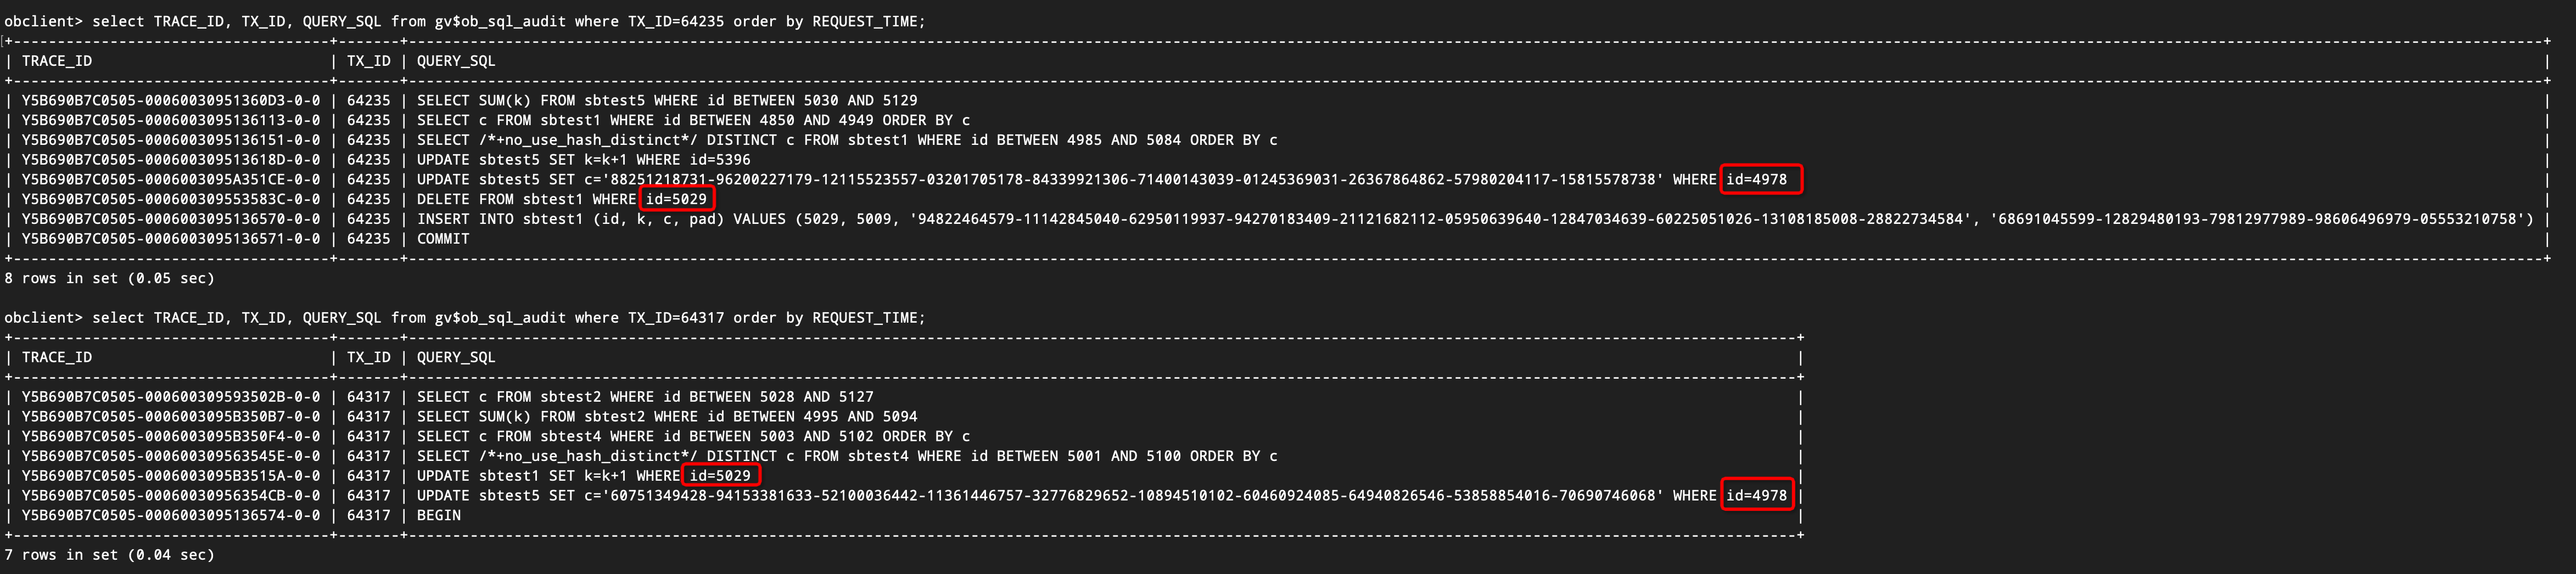
As shown in the figure, transaction 1 and transaction 2 have formed a cross-dependency, namely:
- Transaction 1 updates the row with id=4978.
- Transaction 2 updates the row with id=5049.
- Transaction 1 updates the row with id=4978.
- Transaction 2 deletes the row with id=5049.
After the deadlock occurs, transaction 64317 is rolled back and transaction 64235 is successfully committed. Since transaction 64317 was created later than transaction 64235, you can find the first SQL command of transaction 64317 in the sql_audit view and determine whether it is a deadlock SQL command based on the
request_timefield of the SQL command.SELECT REQUEST_TIME, SVR_IP, SVR_PORT, SQL_EXEC_ID, TRACE_ID, TENANT_ID, TX_ID, SQL_ID, QUERY_SQL, PLAN_ID, PARTITION_CNT, IS_INNER_SQL, ELAPSED_TIME, EXECUTE_TIME, APPLICATION_WAIT_TIME FROM gv$ob_sql_audit WHERE TX_ID=64317 ORDER BY REQUEST_TIME;View the logs based on the trace ID in the preceding query result to find the rolled-back transaction. The error code 6002 indicates a rollback, and the abort reason 4101 indicates a deadlock.
Find the SQL log that causes the conflict of the killed transaction. The last log of the SQL log file contains the error code 4101. However, the sysbench client returns an error code 6002 instead of a deadlock error code.
[2023-07-11 15:32:40.263794] INFO [SERVER] send_error_packet (obmp_packet_sender.cpp:317) [28473][T1002_L0_G0][T1002][Y5B690B7C0505-00060030956354CB-0-0] [lt=14] sending error packet(err=-4101, extra_err_info=NULL, lbt()="0x1029cb40 0x832fadc 0x82e32f7 0x5b65d4f 0x5960718 0x595c58f 0x595a25a 0x8075f6c 0x595964c 0x80754ea 0x595665a 0x8075b24 0x1061b777 0x10613e9f 0x7f0215489e25 0x7f0214f48f1d")Find the log corresponding to the last "BEGIN" command of the transaction (because the transaction does not explicitly execute the
commitcommand. The next transaction'sbegincommand causes the current transaction to implicitly commit. Therefore,beginis the last SQL command of the transaction). You can find the error code 6002 in the log. Sysbench does not return a deadlock error but a rollback error.[2023-07-11 15:32:40.305922] INFO [SERVER] send_error_packet (obmp_packet_sender.cpp:317) [28472][T1002_L0_G0][T1002][Y5B690B7C0505-0006003095136574-0-0] [lt=37] sending error packet(err=-6002, extra_err_info=NULL, lbt()="0x1029cb40 0x832fadc 0x82e32f7 0x5a55e57 0x5960c40 0x595c58f 0x595a25a 0x8075f6c 0x595964c 0x80754ea 0x595665a 0x8075b24 0x1061b777 0x10613e9f 0x7f0215489e25 0x7f0214f48f1d")If no log is found, it may be due to log throttling. In this case, increase the system log bandwidth limit:
alter system set syslog_io_bandwidth_limit='2G';
Solution
Based on the preceding analysis of the cause, you can draw the following conclusions:
- In the default
rand-type=specialscenario, a large number of key conflicts may occur, which can lead to deadlocks. In this scenario, the Sysbench test will exit. - In the default
rand-type=specialscenario, if thetablesandtable_sizeparameters are also small, deadlocks occur more frequently, which can cause a large number of transactions to be blocked. In this case, the test threads cannot exit in time, resulting in a period (a few minutes) of zero TPS. Occasionally, the TPS can be greater than zero. - Transactions that encounter deadlocks will be rolled back with error code 6002 (instead of 1213).
- If the
ob_query_timeoutparameter is set to a long value and the deadlock detection feature does not take effect, the transaction cannot be killed, and the SQL statement will be blocked. In this case, the TPS will be zero for a long time and no errors will be reported.
To resolve the issue of zero TPS and occasional errors, you can try the following methods:
- Set the
--rand-type=uniformparameter to change the data distribution type. - If you do not want to change the data distribution type, increase the size of the dataset: for example, set
tables=100,table_size=1000000. - If you do not want to modify the data distribution type or the dataset size, you can set the
--mysql-ignore-errors=1062,1213,6002parameter to ignore error codes. However, this setting cannot avoid deadlocks.