


In the OceanBase Database optimizer, statistics are stored as regular data in internal tables, and a local statistics cache is maintained to speed up the optimizer's access to statistics. In versions earlier than OceanBase Database V4.0, statistical data was collected during daily major compactions. However, this process was incremental and occasionally led to inaccuracies in the statistical data. Moreover, major compactions could not collect histogram information, making it unable to address scenarios where data skew existed. To tackle these issues, OceanBase Database introduced a new methodology for statistics since V4.0. The process of collecting statistics was decoupled from major compactions. Now, daily major compactions no longer involve the collection of statistical data, which means that execution plans are also no longer affected by the daily major compaction activity.
Types of statistics
In the OceanBase Database optimizer, statistics are primarily categorized into four types: table statistics, column statistics, index statistics, and materialized view refresh statistics. The following table lists basic statistics types of the four categories.
Category |
Basic statistics types |
|---|---|
| Table statistics |
|
| Column statistics |
|
| Index statistics |
|
| Materialized view refresh statistics |
|
Histograms and their benefits
Histograms are a special form of column statistics. By default, the optimizer considers that data is evenly distributed in a column and estimates the number of rows based on this feature. However, in real scenarios, data distribution is uneven in most tables. As a result, the optimizer inaccurately estimates the number of rows and cannot select the optimal execution plan. A histogram helps the optimizer estimate the number of rows more accurately. In a histogram, data is stored in a series of ordered buckets to describe the statistical distribution features of the column. The optimizer can estimate a more accurate number of rows based on a histogram. Each bucket of a histogram contains the following information:
Amount of data accumulated in the current bucket (including the sum of the current bucket and its previous buckets)
The end value of the current bucket.
The occurrence frequency of the end value of the current bucket.
Currently, the optimizer of OceanBase Database supports three types of histograms: frequency histograms, TopK histograms, and hybrid histograms. When collecting statistics, the optimizer will choose the appropriate type of histogram based on the actual data distribution of the column. The specific strategy is illustrated in the following figure.
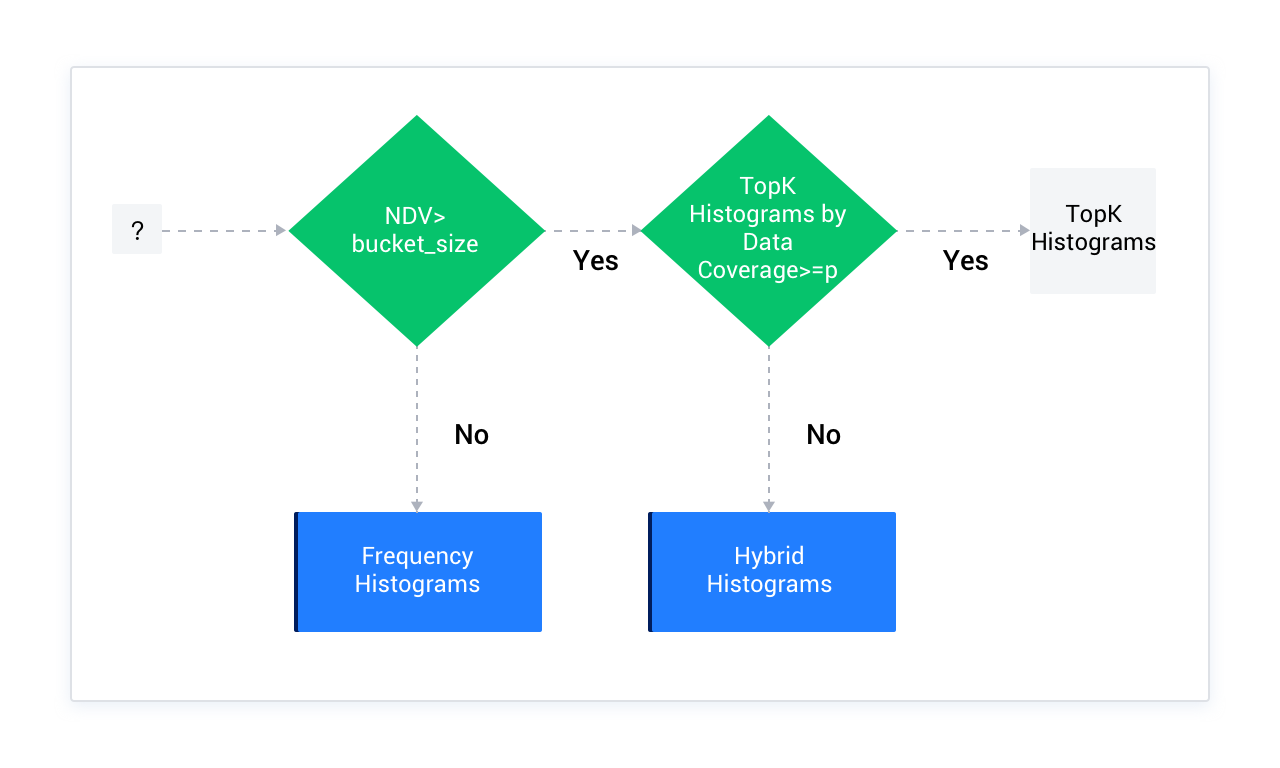
In the figure above:
- NDV indicates the number of distinct values in a column.
- bucket_size indicates the number of buckets for the histogram. The default value is 254.
- p indicates the minimum percentage threshold expected for the TopK histogram. The calculation formula is
(1 - (1/bucket_size)) × 100. If the default bucket size 254 is used, the corresponding minimum percentage threshold is 99.6.