


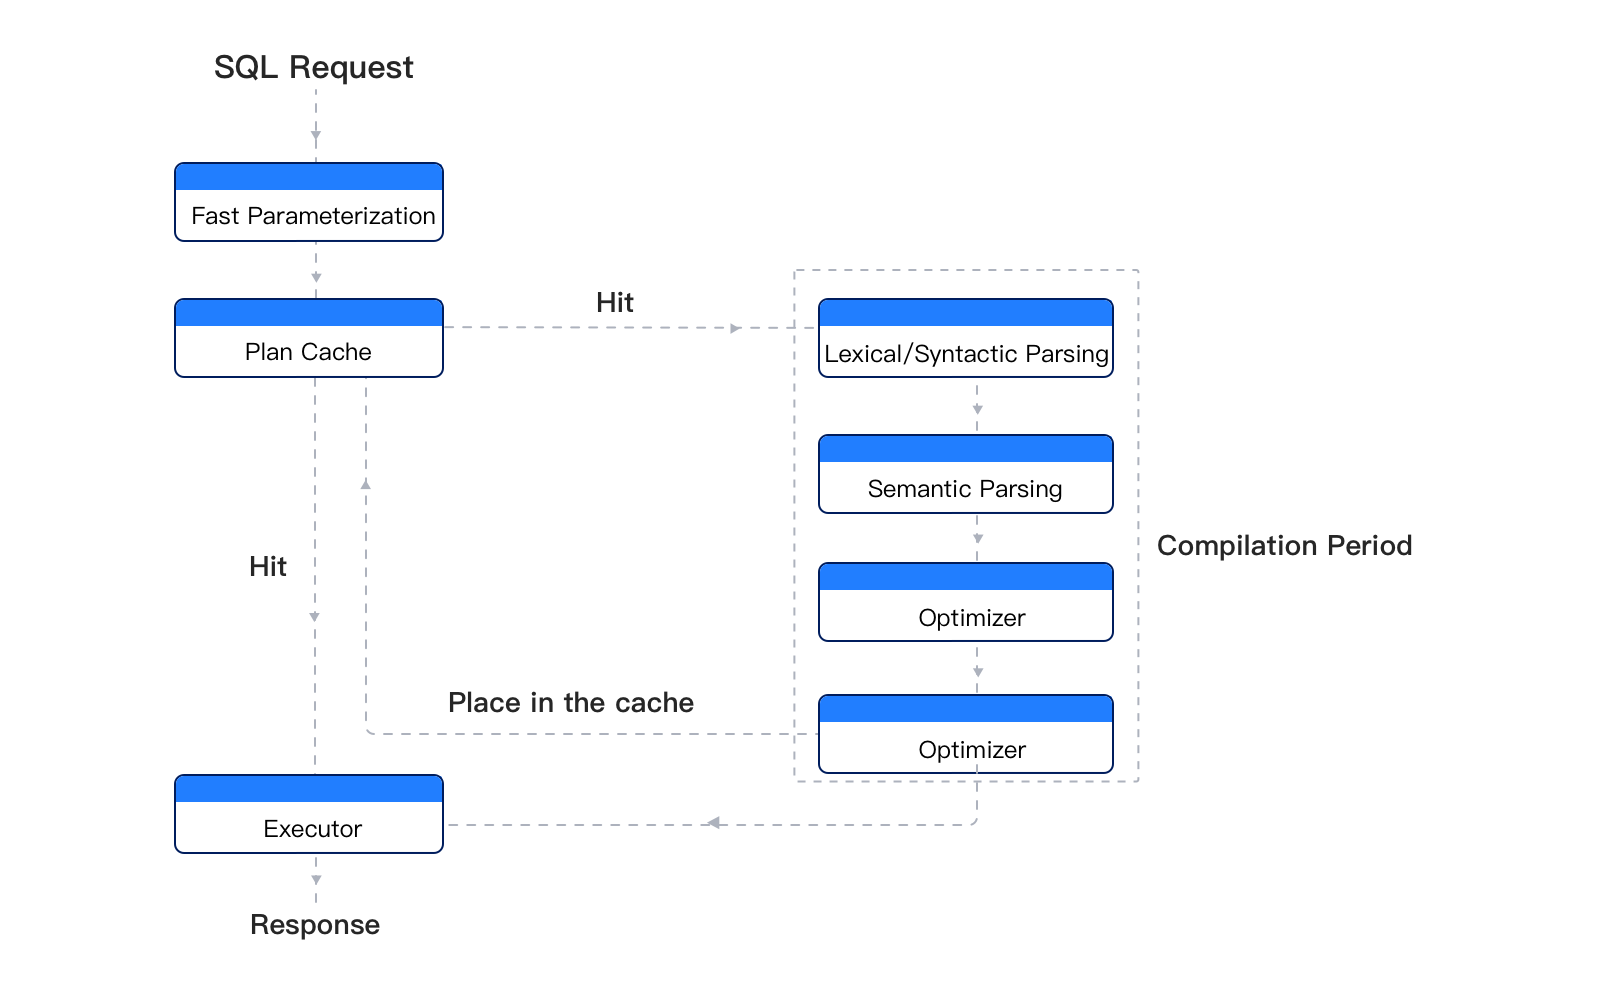
The execution process of an SQL request is divided into the compilation phase and the execution phase. The compilation phase includes several sub-phases such as lexical analysis, syntax parsing, syntax optimization, and code generation. Ultimately, this phase generates an execution plan, which is then submitted to the executor for execution and returns the result. The process of parsing an SQL request and generating an execution plan is called a hard parse. Hard parsing consumes certain resources and affects SQL response time. To avoid the overhead of hard parsing for every request, execution plans are stored in the plan cache. When subsequent identical SQL requests arrive, the system first checks whether the plan cache contains a matching plan. If a match is found, the cached plan is directly extracted and submitted to the executor for execution and result return—this is known as a soft parse. Therefore, whether an SQL request hits the plan cache and whether the plan is optimal are key factors in performance optimization.
The optimizer may generate a suboptimal execution plan for various reasons, such as missing indexes, outdated statistics, or differences between large and small user accounts. When a suboptimal execution plan is used, it can result in a higher number of logical reads and scanning of more data, leading to increased response time and reduced throughput.
You can use the V$OB_SQL_AUDIT view to determine whether a performance issue is related to SQL and to identify suspicious SQL statements. Further, by examining execution plan-related views, you can determine if there are problems with the execution plan. If the execution plan is not optimal, you can use the CREATE OUTLINE statement to bind an execution plan, or take measures such as scaling out or rate limiting to restore performance.
Note
For more information about V$OB_SQL_AUDIT, see V$OB_SQL_AUDIT (Oracle-compatible mode) and V$OB_SQL_AUDIT (MySQL-compatible mode).
For example, the following example demonstrates how to retrieve top SQL statements and determine whether there are any SQL issues. The SQL statement with SQL_ID 2705182A6EAB699CEC8E59DA80710B64 ranks first among top SQL statements, consuming the most tenant resources and having a high number of logical reads. This is an SQL statement that requires optimization.
obclient>
select SQL_ID,
avg(ELAPSED_TIME),
avg(QUEUE_TIME),
avg(ROW_CACHE_HIT + BLOOM_FILTER_CACHE_HIT + BLOCK_CACHE_HIT + DISK_READS) avg_logical_read,
avg(execute_time) avg_exec_time,
count(*) cnt,
avg(execute_time - TOTAL_WAIT_TIME_MICRO ) avg_cpu_time,
avg( TOTAL_WAIT_TIME_MICRO ) avg_wait_time,
WAIT_CLASS,
avg(retry_cnt)
from v$OB_SQL_AUDIT
group by 1
order by avg_exec_time * cnt desc limit 10;
+----------------------------------+-------------------+-----------------+------------------+---------------+--------+--------------+---------------+------------+----------------+
| SQL_ID | avg(ELAPSED_TIME) | avg(QUEUE_TIME) | avg_logical_read | avg_exec_time | cnt | avg_cpu_time | avg_wait_time | WAIT_CLASS | avg(retry_cnt) |
+----------------------------------+-------------------+-----------------+------------------+---------------+--------+--------------+---------------+------------+----------------+
| 2705182A6EAB699CEC8E59DA80710B64 | 54976.9269 | 43.8605 | 17664.2727 | 54821.5828 | 11759 | 54821.5828 | 0.0000 | OTHER | 0.0000 |
| 32AB97A0126F566064F84DDDF4936F82 | 1520.9832 | 380.7903 | 63.7847 | 789.6781 | 63632 | 789.6781 | 0.0000 | OTHER | 0.0000 |
| A5F514E873BE9D1F9A339D0DA7481D69 | 44032.5553 | 44.5149 | 8943.7834 | 43878.1405 | 1039 | 43878.1405 | 0.0000 | OTHER | 0.0000 |
| 31FD78420DB07C11C8E3154F1658D237 | 7769857.0000 | 35.7500 | 399020.7500 | 7769682.7500 | 4 | 7769682.7500 | 0.0000 | NETWORK | 1.0000 |
| C48AEE941D985D8DEB66892228D5E845 | 8528.6227 | 0.0000 | 0.0000 | 8450.4047 | 1601 | 8450.4047 | 0.0000 | OTHER | 0.0000 |
| 101B7B79DFA9AE801BEE4F1A234AD294 | 158.2296 | 41.7211 | 0.0000 | 46.0345 | 286758 | 46.0345 | 0.0000 | OTHER | 0.0000 |
| 1D0BA376E273B9D622641124D8C59264 | 1774.5924 | 0.0049 | 0.0000 | 1737.4885 | 5081 | 1737.4885 | 0.0000 | OTHER | 0.0000 |
| 64CF75576816DB5614F3D5B1F35B1472 | 1801.8767 | 747.0343 | 0.0000 | 827.1674 | 10340 | 827.1674 | 0.0000 | OTHER | 0.0000 |
| 23D1C653347BA469396896AD9B20DCA1 | 5564.9419 | 0.0000 | 0.0000 | 5478.2228 | 1257 | 5478.2228 | 0.0000 | OTHER | 0.0000 |
| FA4F493FA5CE2DCC64F51CF3754F96C6 | 2478.3956 | 378.7557 | 3.1040 | 1731.1802 | 3357 | 1731.1802 | 0.0000 | OTHER | 0.0000 |
+----------------------------------+-------------------+-----------------+------------------+---------------+--------+--------------+---------------+------------+----------------+
10 rows in set (1.34 sec)