


Suspected SQL statements are statements that meet some criteria based on the statement, execution history, and table structure and may cause performance issues. You can handle suspected SQL statements based on the recommendation given.
Procedure
In the left-side navigation pane, click Tenants and click a tenant in the Tenants list to go to the Overview page of the tenant.
In the left-side navigation pane, click SQL Diagnosis . The SQL Diagnosis page appears.
The SQL diagnostic data is not displayed on the SQL Diagnosis page if you do not set the values of both the cluster parameter enable_sql_audit and the tenant parameter ob_enable_sql_audit to True. You can click Change Cluster Parameters in the prompt box to modify the parameter values.
Click the Suspected SQL tab.
Filter the suspected SQL statements.
Specify the filter conditions
Time Range: You can select the last 5 minutes, last 10 minutes, last 20 minutes, last 30 minutes, last 1 hour, and last 3 hours from the drop-down list of the Time Range field. You can also select Custom Time from the drop-down list and specify the start time and end time as needed. By default, the information of the last 30 minutes is displayed.
Internal SQL: If you select this option, the SQL statements internally initiated by OceanBase Database are displayed in the query result.
Keywords: The SQL statements that contain the specified keywords are displayed in the query result. The keywords filter SQL statements in the same way as the SQL Like operator. The entered strings are automatically prefixed and suffixed with a percent sign (%).
Advanced Search: You can select SQL ID , Executions , and Executions per Second from the drop-down list, and specify the values. The SQL statements matching the metric values are displayed in the query result.

Click Query to list all the SQL statements that meet the filter conditions.
Click Export to export all the suspected SQL statements in the query result.
View the information of suspected SQL statements.
On the Suspected SQL tab, you can copy the SQL text, filter it by database, sort it by the number of executions, average CPU time, average response time, total response time, and last execution time, and view the diagnosis result.

You can click the SQL text to go to the corresponding SQL text page.
On the SQL Text page, you can Copy or View All SQL information.

View diagnosis result: You can view the diagnosis result for a specified time range. The following table describes some diagnoses and their suggested solutions.
DiagnosisRelated parameterIndex analysis requiredSQL risk levelDescription and suggestionAfter the execution plan was changed, the performance was decreased. ocp.perf.sql-diag.performance-degradation-after-plan-changed-configNo High The execution plan of the SQL statement was changed, and the performance of the new plan was decreased. Check with the DBA. You can use an outline to fix the execution plan to verify whether the SQL statement is problematic. Table scan without available index ocp.perf.sql-diag.table-scan-index-not-exists-configYes High During the execution of the SQL statement, a full table scan was performed on some related tables because they did not have indexes available. We recommend that you create appropriate indexes. Table scan with unused index ocp.perf.sql-diag.table-scan-index-not-exists-configYes High All tables involved in the execution of the SQL statement are indexed. However, a full table scan was performed on some of these tables because their indexes were not used. Check the data distribution and business scenario. Hints did not take effect. ocp.perf.sql-diag.ineffective-hint-configYes High An index was specified in the hint of the SQL statement, but the specified index was not used during execution. Check whether the hint of the SQL statement matches the actual execution plan. The performance becomes lower. ocp.perf.sql-diag.performance-degradation-configN/A Medium During the diagnosis period, the average CPU time consumed for the execution of the SQL statement is longer than the historical average. Check the changes in data distribution and the queue in the tenant. Poor performance despite the use of index ocp.perf.sql-diag.awful-performance-index-used-configYes Medium The index was used for table access during the execution of the SQL statement, but the performance was poor. Check the data distribution and business scenario. Execution spikes. ocp.perf.sql-diag.execution-spike-configN/A Medium The executions of the SQL statement suddenly increased during a certain period. You can view the number of executions in the Historical Trends tab of the SQL Details . Check the business volume. A spike in the number of executions of an SQL statement may cause the overall performance to decrease. Row Lock contention ocp.perf.sql-diag.row-lock-contention-high-configN/A Medium Check your business scenarios, whether the SQL statements of the select for updatetype were executed more frequently than the specified value, and whether the CPU time was greater than the specified value.CPU utilization exceeds threshold ocp.perf.sql-diag.cpu-time-proportion-high-configN/A Low The CPU utilization was too high during the diagnosis period. The CPU utilization = CPU time for executing the SQL statement/CPU time for executing all SQL statements of the tenant * 100%. Check your business scenarios, data distribution changes, request increases, and execution plan changes. You can search for a parameter from the System Parameters of OCP, and modify the default parameter value to customize the target and criteria for the diagnosis. For more information, see SQL performance module.
View historical trends: You can view the historical trends of SQL statements for different IP addresses and time ranges.

View execution plans: You can select the OBServers and time range to view details of execution plans. The table contains the following columns: Plan Hash , Merged Version , Execution Plan Type , Plan Generation Time , CPU Time , and Retrieval Rate . You can copy the Plan Hash string of a plan.
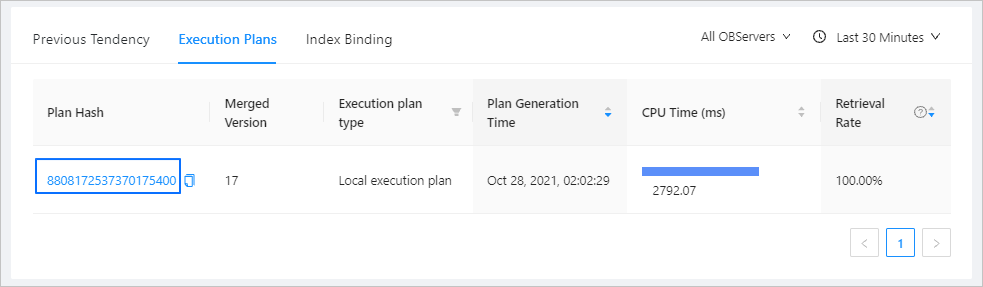
You can click the Plan Hash string of an execution plan to view its details.
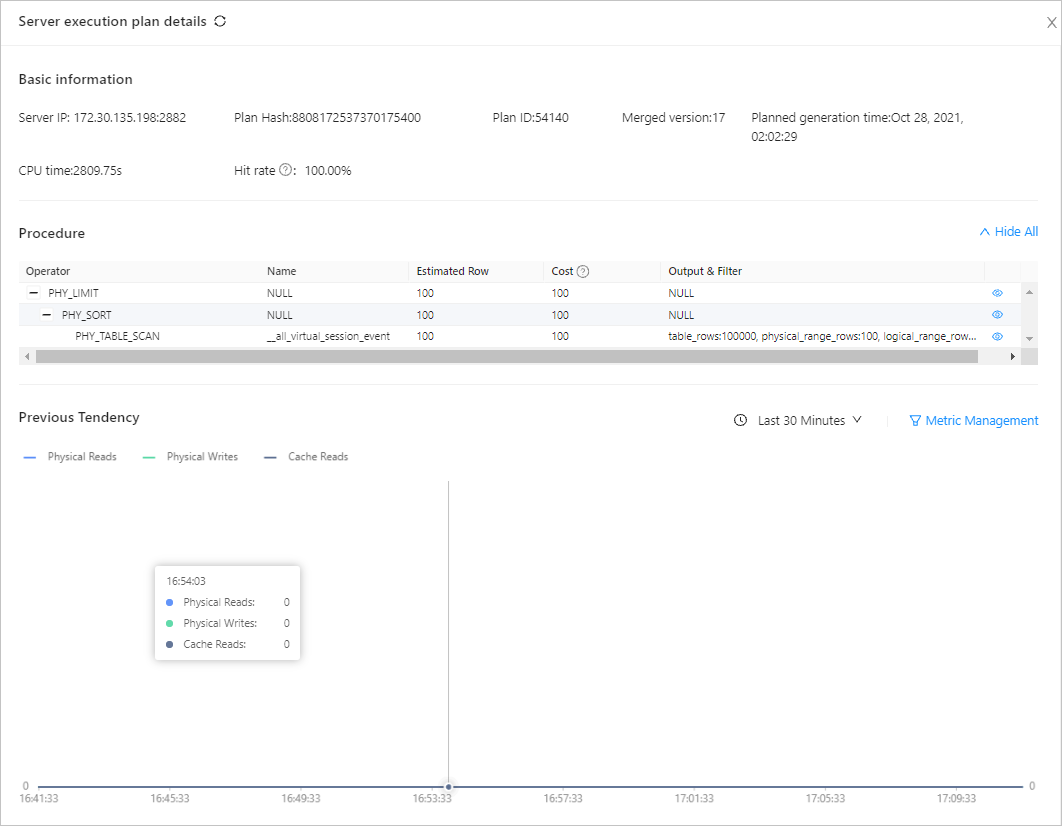
On the details page of the plan, you can click the IP address in the Server IP column to view the execution details of the plan on this server.
View index binding: Index binding information is displayed for user-created tables with indexes.
You can filter the execution plans by indexing status and type. You can also click the button in the Binding column to bind an SQL statement to an index. You can create indexes in a command line tool or OceanBase Developer Center (ODC). Note
The outline feature relies on the hint and plan cache features of OceanBase Database. The hint feature determines the selection of the physical plan generation path by specifying the index and the connection method. The plan cache caches physical plans for SQL statements. When the same SQL statement is executed again in the same environment, the system reads its execution plan from the plan cache. It does not have to go through the parser, resolver, rewriter, and optimizer modules again. This speeds up the execution of SQL statements. The outline feature uses hints to specify how to fix plans by modifying the physical execution plan in the plan cache.
OCP allows you to bind an index to an outline. You can bind an index to an SQL ID, so that OceanBase Database selects this index when it executes the SQL statement. At present, you can bind only one index to an SQL ID. For more information, see Plan binding.
