


OBProxy can forward user-initiated data access requests to the corresponding OBServer node. OceanBase Cloud Platform (OCP) allows you to create an OBProxy cluster, view information about the OBProxy clusters, and view the OBProxy monitoring information.
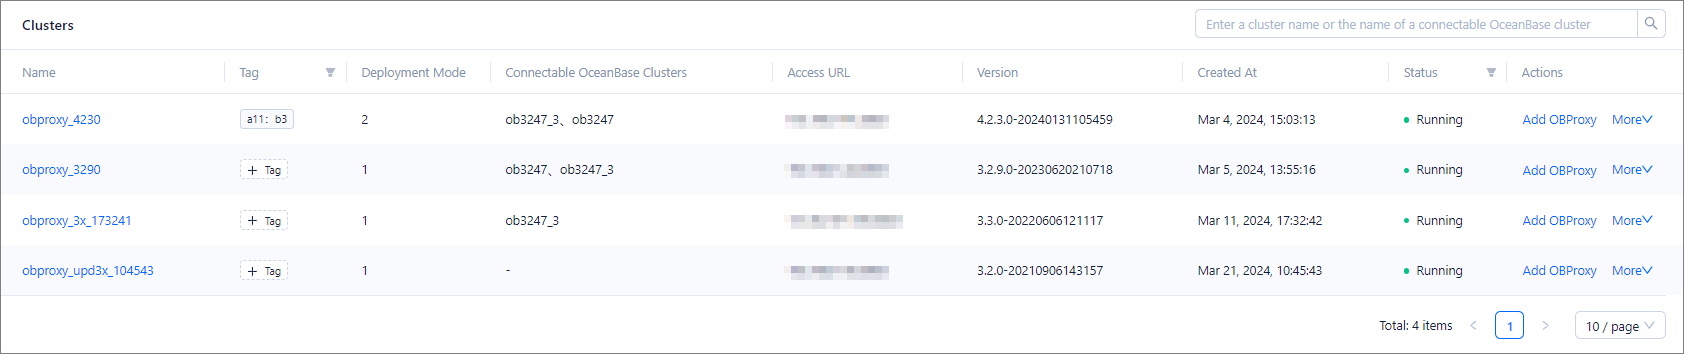
View OBProxy clusters
In the OBProxy cluster list, you can view information about OBProxy clusters in the following columns: Name, Tag, Deployment Mode, Connectable OceanBase Clusters, Access URL, Port, Version, Status, and Created At.
You can click the name of an OBProxy cluster in the Name column to go to the overview page of the cluster.
You can filter the OBProxy clusters by status.
You can hover the pointer over the Tag column of an OBProxy cluster to view all its tags. You can click the Edit icon to manage the tags. For more information, see Manage tags.
You can create an OBProxy cluster, take over an OBProxy cluster, add an OBProxy cluster, delete an OBProxy cluster, stop or restart an OBProxy cluster, and migrate an OBProxy cluster.
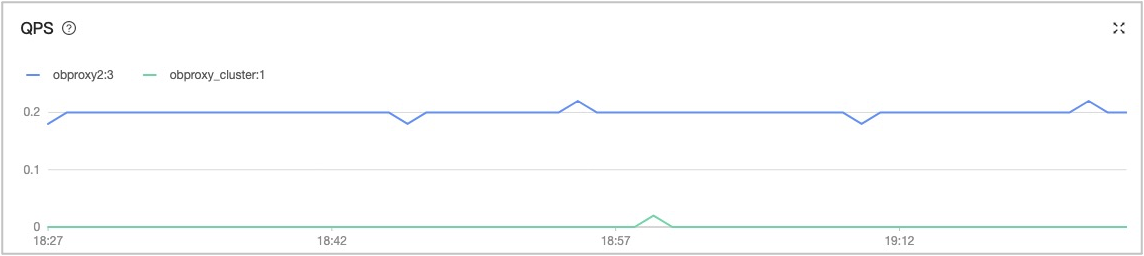
Top 5 OBProxy clusters
In the OBProxy Monitoring Top5 section, you can view relevant information in the following charts: TPS, QPS, Client Connections, Server Connections, SQL Response Time, Route table queries, and Net bytes. You can click Last 1 Hour and select Last 1 Hour, Last 24 Hours, or Last 7 Days to view the monitoring data in the corresponding period.
Parameter |
Description |
|---|---|
| TPS | The number of transactions processed per second. |
| QPS | The number of requests. commit: the number of Commit requests processed per second.delete: the number of Delete requests processed per second.insert: the number of Insert requests processed per second.large: the maximum number of requests processed per second.select: the number of Select requests processed per second.sequence: the number of Sequence requests processed per second.slow: the number of slow requests processed per second.update: the number of Update requests processed per second.others: the number of other requests processed per second. |
| Client Connections | The number of client connections. |
| Server Connections | The number of server connections. |
| SQL Response Time | The time spent on processing an SQL statement. commit: the average time spent on processing a Commit request, in ms.delete: the average time spent on processing a Delete request, in ms.insert: the average time spent on processing an Insert request, in ms.prepare_send_request: the average time spent on preparing for sending a request, in ms.server_process_request: the average time spent on processing a request on the server, in ms.select: the average time spent on processing a Select request, in ms.sequence: the average time spent on processing a Sequence request, in ms.update: the average time spent on processing an Update request, in ms.others: the average time spent on processing a request of a type other than those listed above, in ms. |
| Route table queries | The routing table. hit: the average number of routing table hits per second.partition: the average number of partition entry queries per second.route: the average number of route entry queries per second.success: the average number of successful routing table queries per second.table: the average number of table entry queries per second. |
| Net bytes | The data volume of network requests in the unit of bytes. client_request: the number of request bytes on the client.client_response: the number of response bytes on the client.server_request: the number of request bytes on the server.server_response: the number of response bytes on the server. |