


In database O&M, SQL execution errors are very common and can directly impact business. There are many reasons for SQL execution errors, such as failed database connection, insufficient user privileges, syntax errors, or data not meeting query conditions.
To help you quickly identify the root cause and efficiently resolve issues, the following sections summarize a clear and practical SQL error troubleshooting process. This process provides explicit steps to enhance issue resolution efficiency and minimize business impact, offering strong support for daily O&M work.
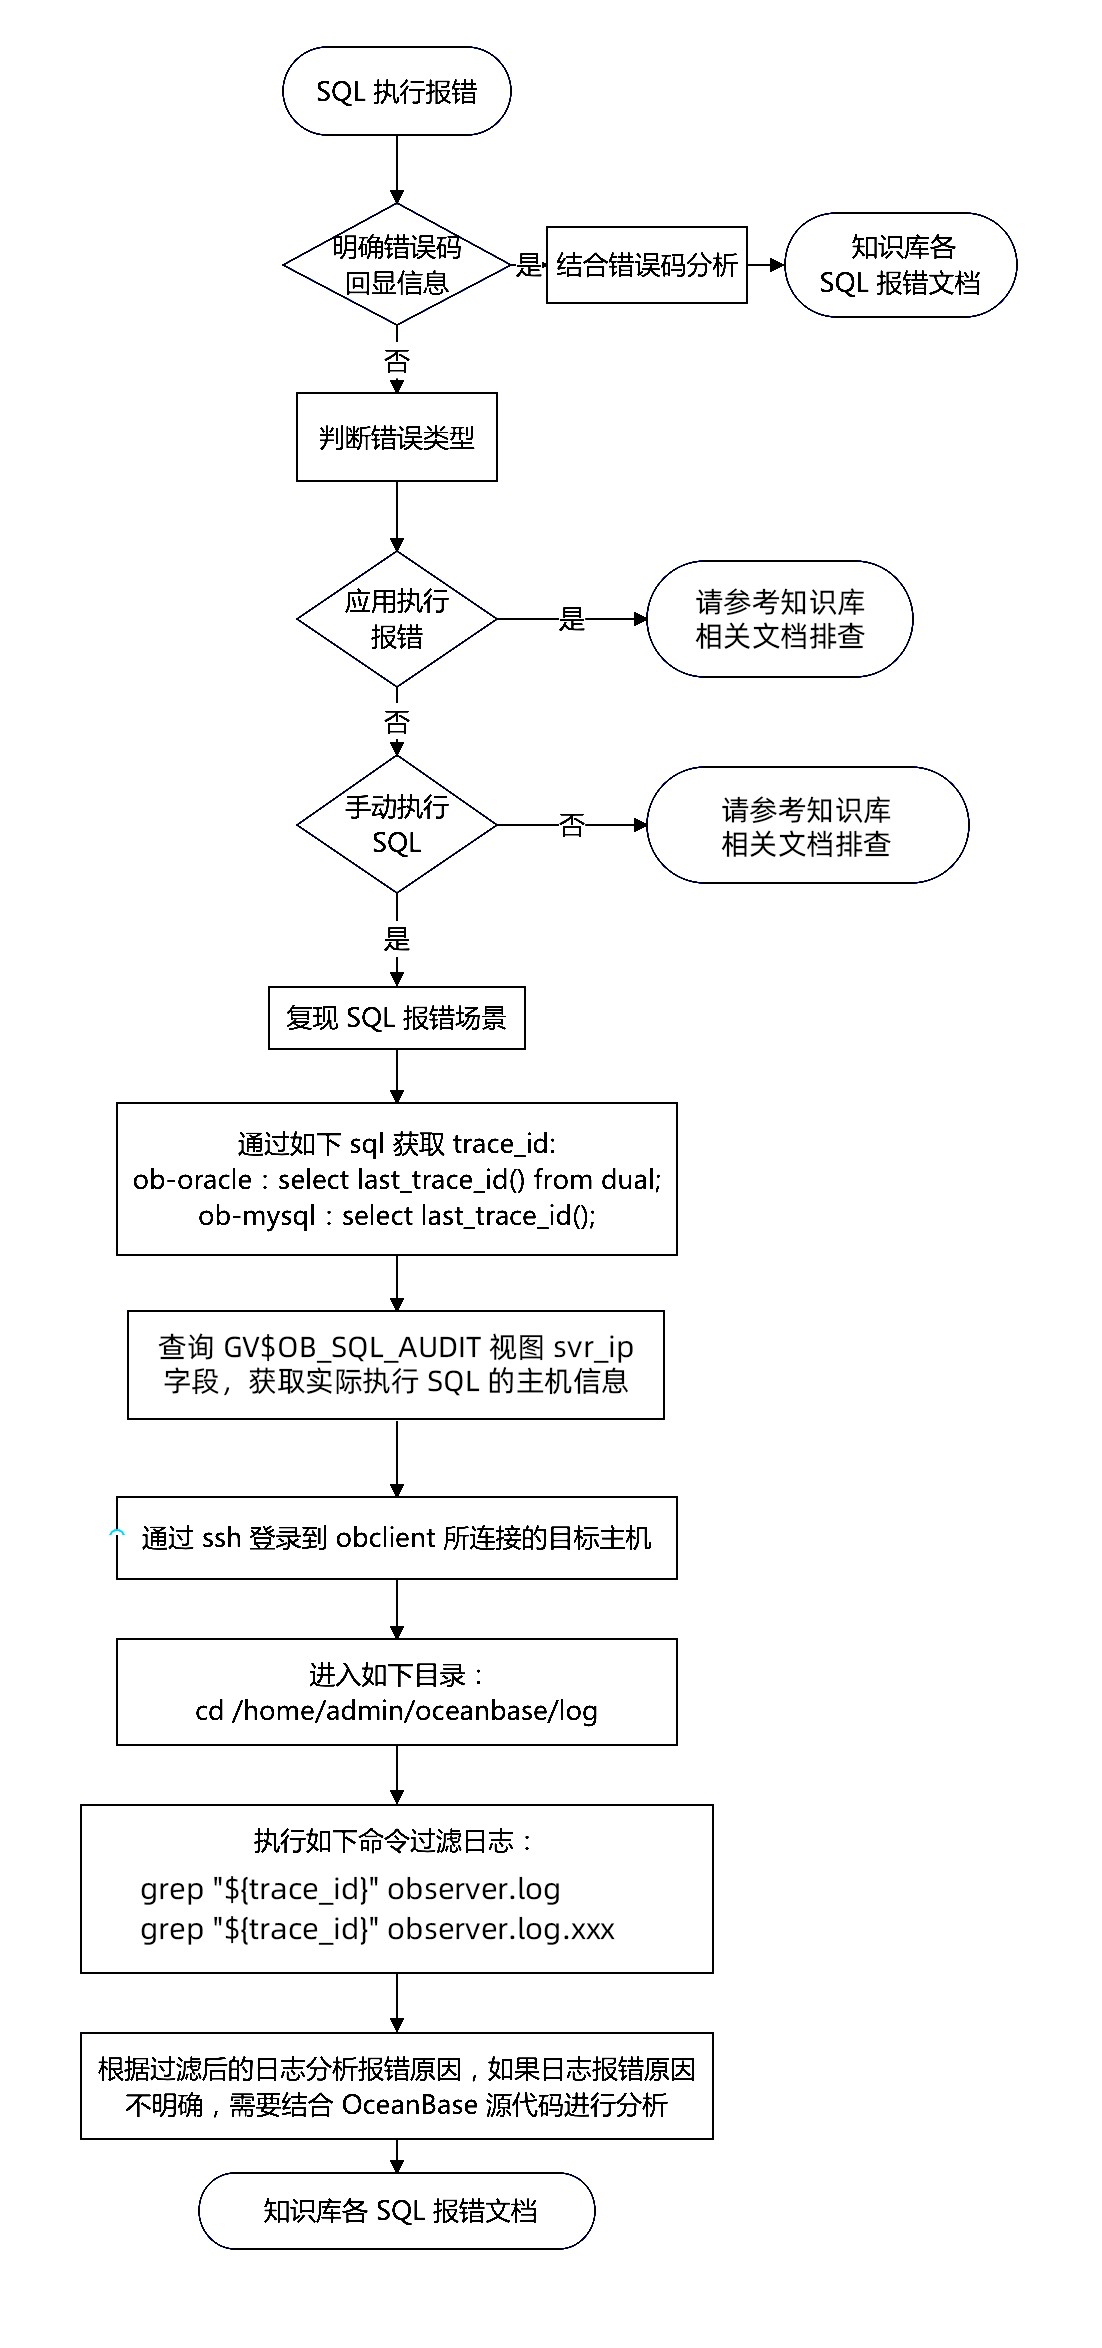
The SQL execution error troubleshooting process is shown in the following figure.
Procedure
If an SQL execution error occurs, you can troubleshoot the issue based on the following procedure.
After an SQL execution error occurs, view the error message. If the error message contains an error code, troubleshoot the issue based on the error code. If the error message does not contain an error code, determine the error type. The error type can be an application execution error or an SQL execution error:
If the error is an application execution error, troubleshoot the issue based on Application exceptions--Error message does not contain OceanBase error code or Application exceptions--Error message contains OceanBase error code.
If the error is an SQL execution error, check whether the error can be reproduced manually.
If the error can be reproduced, reproduce the scenario where the error occurred. Connect to the OceanBase cluster through port 2881 or 2883 based on the original scenario and execute the original SQL statement to reproduce the scenario.
After reproducing the SQL execution error, perform the following steps to collect information for troubleshooting.
Execute the following statement to obtain
trace_id.Notice
You must execute the following statement immediately after the SQL statement that caused the error is executed; otherwise, the
trace_idobtained by executing the following statement will not be that of the SQL statement that caused the error.MySQL modeOracle modeThe statement to obtain
trace_idin MySQL mode is as follows:obclient> SELECT last_trace_id();The statement to obtain
trace_idin Oracle mode is as follows:obclient> SELECT last_trace_id() FROM DUAL;Obtain the host information based on the obtained
trace_id.Generally, an OceanBase cluster is deployed across multiple nodes. You can execute the following statement to obtain the node that executed the SQL statement and then filter logs based on the node.
MySQL modeOracle modeExecute the following statement in MySQL mode:
obclient> SELECT * FROM oceanbase.GV$OB_SQL_AUDIT WHERE trace_id=last_trace_id;Replace
last_trace_idwith thetrace_idobtained in the previous step.Execute the following statement in Oracle mode:
obclient> SELECT * FROM SYS.GV$OB_SQL_AUDIT WHERE trace_id=last_trace_id;Replace
last_trace_idwith thetrace_idobtained in the previous step.Based on the query results in the
GV$OB_SQL_AUDITview, the host corresponding tosvr_ipis the host that executed the SQL statement.Use the
sshcommand to log in to the host based on the obtained host information.Go to the log directory.
Assume that the installation directory of OceanBase Database is
/home/admin/oceanbase. The specific log path depends on your actual environment.cd /home/admin/oceanbase/logExecute the following command to filter out related information from the logs.
grep "${trace_id}" observer.loggrep "${trace_id}" observer.log.xxxReplace
${trace_id}with thetrace_idobtained in the previous steps. Replaceobserver.log.xxxwith a log file that contains timestamps. Replacexxxwith the actual timestamp.Perform troubleshooting based on the information provided in the logs, based on the error code or related error message.
For more information about logs and error codes, see Overview of logs and Overview of error information.
If the information in the logs is unclear, contact technical support for assistance.
Case studies
The following case studies describe some typical scenarios where SQL execution errors occur and how to troubleshoot them.
After the SQL error is reproduced, the error code is included in the return result of the database.
- When a
SELECTstatement contains manyORconditions, or manyAND-connectedINconditions, or manyAND NOTconditions, anSELECTstatement error of-4013, No memory or reach tenant memory limitis returned.
- When a
The error code is included in the log.
- An error of
ErrorCode=5098is returned when an SQL statement is executed to process alongtextfield.
- An SQL execution error of
error 4119 (RPC packet to send too long)occurs, and throughtrace_id, you can queryobserver.logto see the informationobrpc packet payload execced its limit.
- An error of
Other error messages are included in the log.
- If the filter conditions of an SQL statement involve more than 64 fields, an error of
-4002 Invalid argumentis returned.
- If the filter conditions of an SQL statement involve more than 64 fields, an error of
After the SQL error is reproduced, the error code is included in the return result of the database.
- A query statement that contains columns
c1,c2, andc3, where columnsc1andc2hit indexes, andc1orc2has multipleINexpressions. Whenc1,c2, andc3are combined into a vector expression, aninternal erroris returned, with the error codeORA-00600.
- A query statement that contains columns
The error code is included in the log.
- An error of
Timeoutwith the error codeORA-00600is returned when an SQL statement is executed.
- An error of