Overview
To open an anonymous block window, perform the following steps: enter the Database Management page of OceanBase Developer Center (ODC), click Workspace in the top navigation bar, and click Anonymous Block Window .
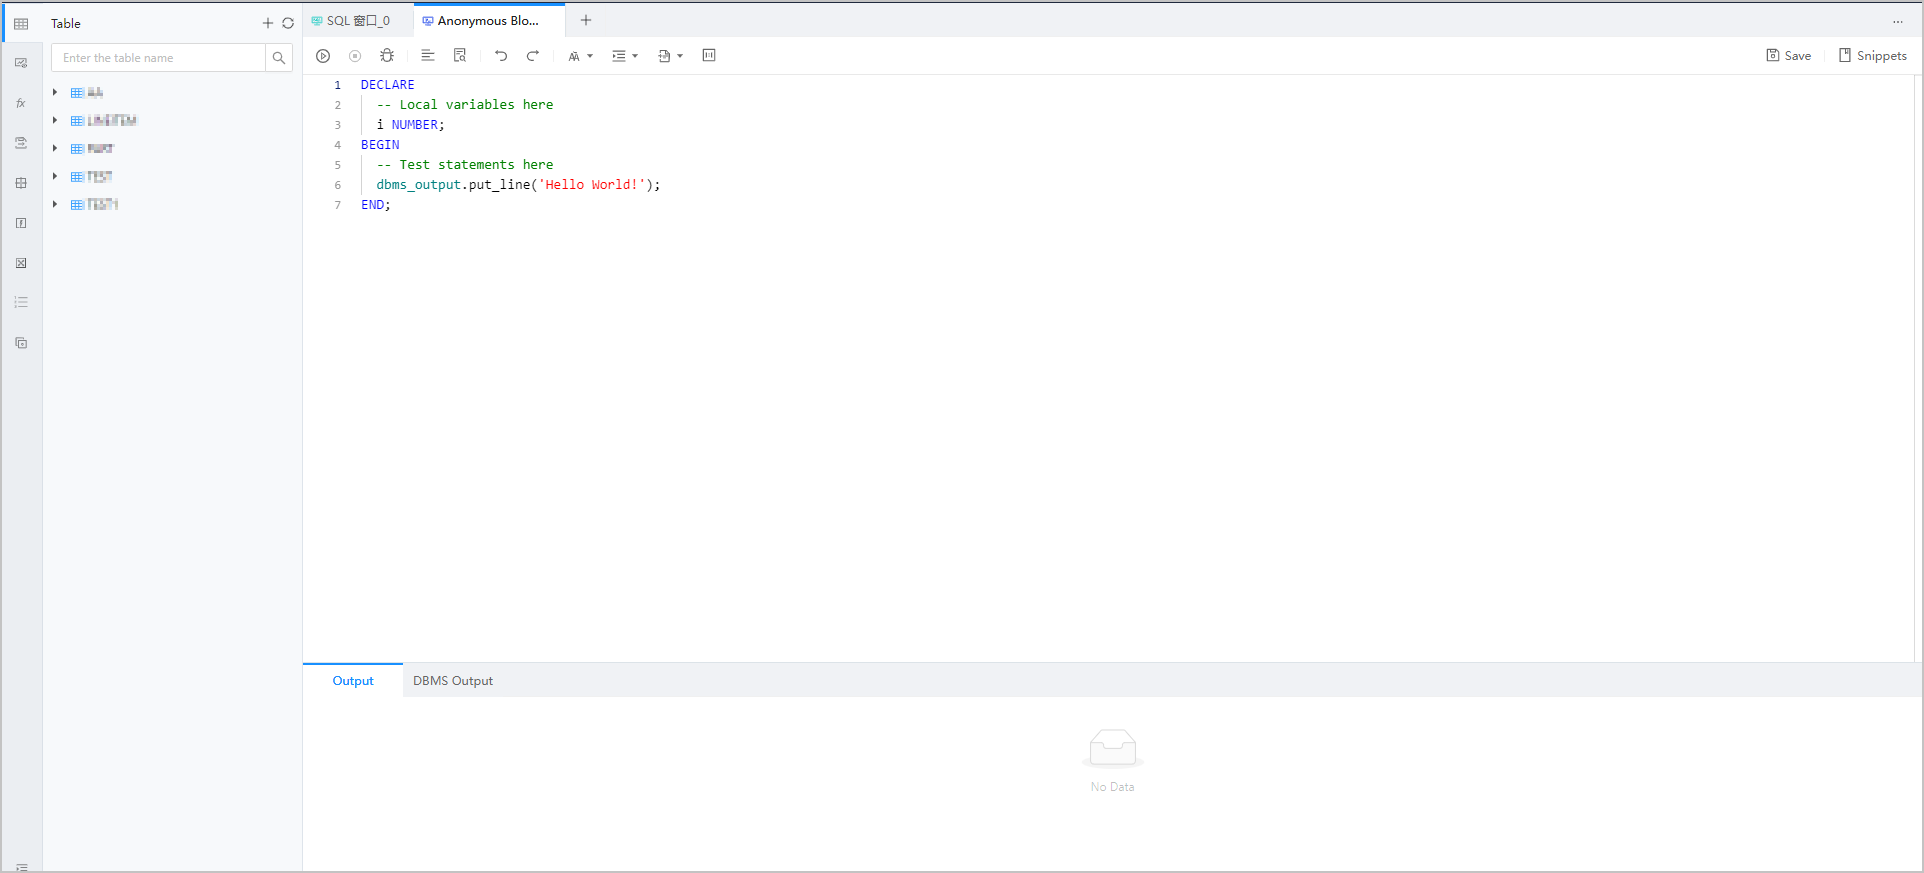
An anonymous block window provides a PL/SQL editing area, the PL/SQL Execution Result and DBMS Output tabs, and the Debugging page.

PL editing area
The editing area of the anonymous block window provides many features for you. For example, when you open a new anonymous block window,
the guidance code is provided to make your script-writing easier.
Database keywords are highlighted in different colors.
It also provides features such as formatting to help you improve your PL/SQL statement writing efficiency.
In addition to the preceding features, the toolbar of the editing area provides the following buttons.
ButtonDescriptionRun Click this button to execute the statements in the code area. Abort Click this button to abort the statement that is being executed. Debug Click this button to open the debugging page to debug the anonymous objects in the code area. Format Click this button to apply the formatting, such as indentation, line break, and keyword highlighting, to the selected SQL statements or all the SQL statements in the current SQL window. Find and Replace You can enter text in the search field to find the specific content and enter text in the replacement field to replace the content found. Undo Click this button to undo the last operation. Redo Click this button to reverse an Undo operation. Case Sensitivity The system supports three capitalization options: All C aps , All Lowercase , and Capitalize First Letter . Click the corresponding option to convert the selected statements in the script to the desired capitalization format. Indent You can add indents to or delete indents from the statements that you selected. Comments You can click Add Comments to convert the statements that you select into comments or click Delete Comment to convert comments to SQL statements. Save Click this button to save the script in the current window. You can open a saved script when you enter the workspace again. Note * You can view only the SQL scripts saved by yourself. The script names must be unique. * After you open a saved script, you can continue to edit it.
PL/SQL Execution Result and DBMS Output tabs
After you click the run icon in the toolbar of the editing area to execute the anonymous block, you can view the information in the Execution Result and DBMS Output tabs under the editing area.
The Execution Result tab displays the execution result of the script. If the execution was successful, Executed is displayed. Otherwise, an error message is displayed.
The DBMS Output tab displays the output of a subprogram that contains PL/SQL output statements, such as
dbms_output.put_line.
Debugging page
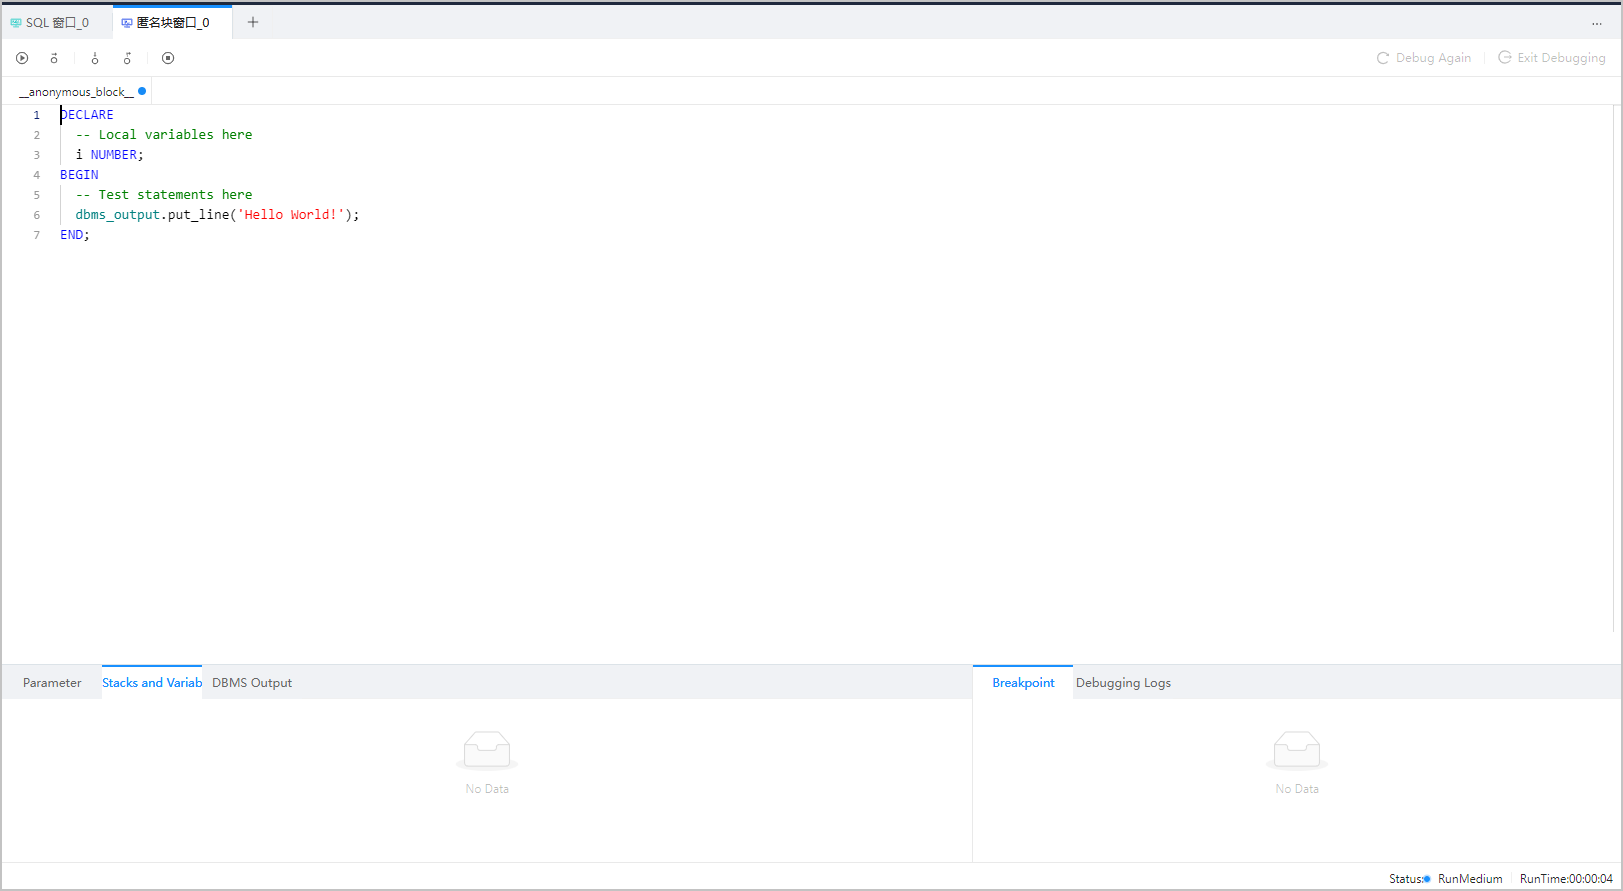
You can debug an anonymous block on the debugging page. To enter this page, click Debug in the toolbar of the editing area.
On the debugging page, you can debug the anonymous block.
Notice
We recommend that you upgrade to OBServer V2.2.77 or later. This is because some versions of OBServer have been found with PL/SQL debugging issues, which may compromise the OBServer stability. ODC V3.2.2 or earlier does not support the debugging feature when you connect ODC to the target instance by using OBProxy. To use the debugging feature, directly connect ODC to the target instance. ODC V3.2.2 and later support PL/SQL debugging when you connect to OBServer by using OBProxy. You have installed the debugging packages such as DBMS_DEBUG and DBMS_OUTPUT in the connected database.

In debugging mode, the toolbar in the editing area provides the following buttons.
Button |
Description |
|---|---|
| Batch Execute | Runs till the next breakpoint. If no breakpoint exists, runs till the end. |
| Step Over | Click this button to step over a given line without stepping into any subprogram. |
| Step Into | Click this button to execute code line by line. If the line includes a call to a stored procedure or function, it steps into the called subprogram. |
| Step Out | For a subprogram, you can click this button to return to the next line of the upper-layer call position. For the main program, this button achieves the same effect as Auto Debugging . |
| Abort Debugging | Click this button to execute the stored procedure till the end and skip breakpoints. |
| Debug Again | Click this button to initiate a new round of debugging on the current object. Unlike Debug , it does not establish a new debugging connection. |
| Exit Debugging | Click this button to close the debugging connection and exit the debugging window. |
In addition to the editing area, the debugging mode also provides the following tabs:
Parameters : displays the definition information and values of all the parameters of the object to be debugged. The definition information includes the parameter name, mode, and type. The values may change as a result of the debugging process.
Stacks and Variables : displays the variables in the current stack and the values of the variables.
DBMS Output : If a subprogram contains PL/SQL output statements, such as
dbms_output.put_line, the output is displayed on this tab.Breakpoint : You can click the line number in the editing area to set a breakpoint, and click the line number again to remove the breakpoint. The Breakpoint tab displays all the breakpoints that you set in their execution order. You can select multiple breakpoints to cancel them at a time. The Actions column of each breakpoint information row provides the Cancel and View actions. You can click Cancel to cancel a breakpoint. After you click View, the cursor moves to the location of the breakpoint in the editing area.
Debugging Logs : displays the debugging logs and error logs. Debugging logs include information about the start and end of debugging and the addition and cancellation of breakpoints.

