This topic describes how to view the history of operation events in OceanBase Developer Center (ODC).
Background
You can view operation records in ODC for the following purposes:
Security compliance: A variety of features provided by operation records help you make sure that operations in your system meet security and compliance requirements.
Real-time monitoring: You can monitor business operations related to public connections in real time through operation records.
Event tracing: Database behaviors can be periodically compared based on operation records, which helps you locate anomaly points and abnormal behaviors in the database and allows you to trace risks. Besides, with operation records, correlated queries and analysis can be performed based on the database access source, to help you find the exact operator who accesses the database.
Operation record list
Note
You can view your own operation records in this list.
Operation records are retained permanently.
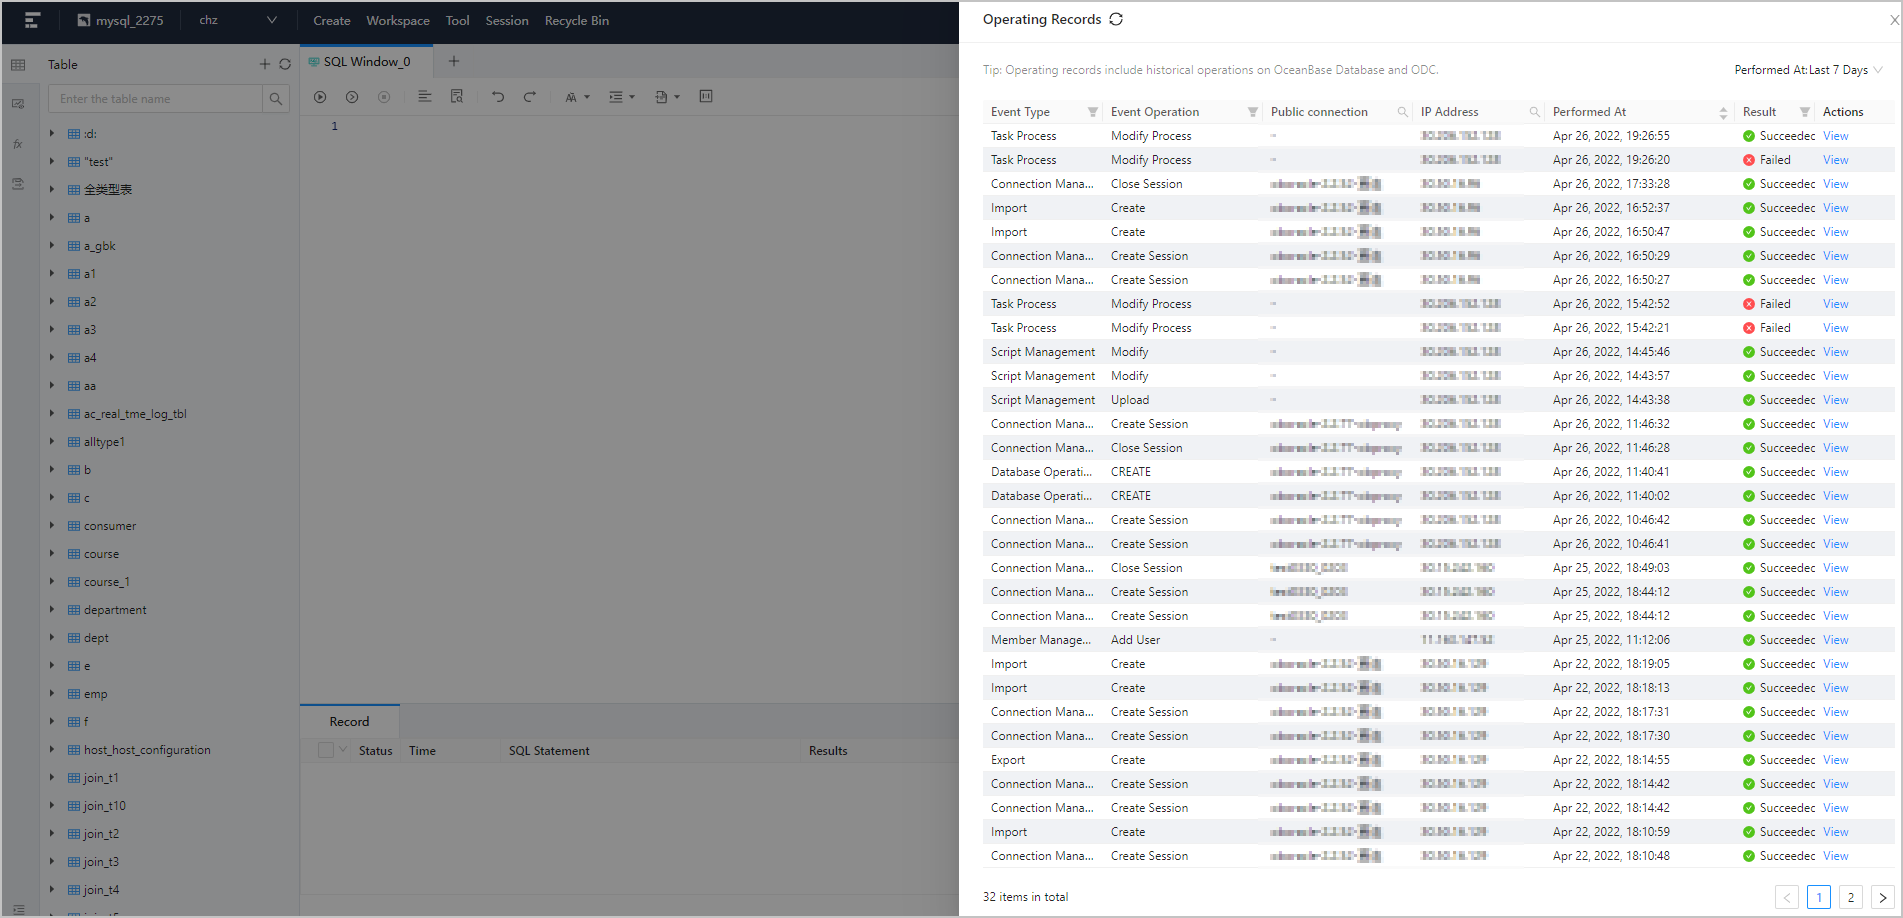
On the Database Management page of ODC, click Operating Records in the top navigation bar.

The Operating Records tab is displayed.

You can click the refresh icon
 to manually refresh the list.
You can select an option from Performed At to filter the operation records by time. Operation records in the last 7 days, 15 days, 30 days, 6 months, or a custom time range can be queried.
The following table describes the basic information displayed in the operation record list.
FieldDescriptionEvent Type The type of the operation event. The following types of operation events are supported: personal settings, password management, connection management, script management, database operations, organization configuration, member management, resource group management, data mocking, database changes, import, export, and task processes. You can click the filter icon  to filter the operation records by event type.
Event Operation The operation performed in the event. You can click the filter icon  to filter the operation records by event operation.
Connection The name of the connection to which the operation belongs. You can click the search icon  to search for the connection to which the operation belongs.
IP Address The IP address. You can click the search icon  to search for the IP address.
Performed At The time when the operation was performed. By default, the operation records are sorted by execution time. The latest record is displayed at the top. You can click the icon  to sort the operation records in ascending or descending order.
Execution Result The execution result. Valid values: Succeeded and Failed . You can click the filter icon  to filter the operation records by execution result.
Actions Indicates the actions you can take. Currently, only View is available.
View operation records
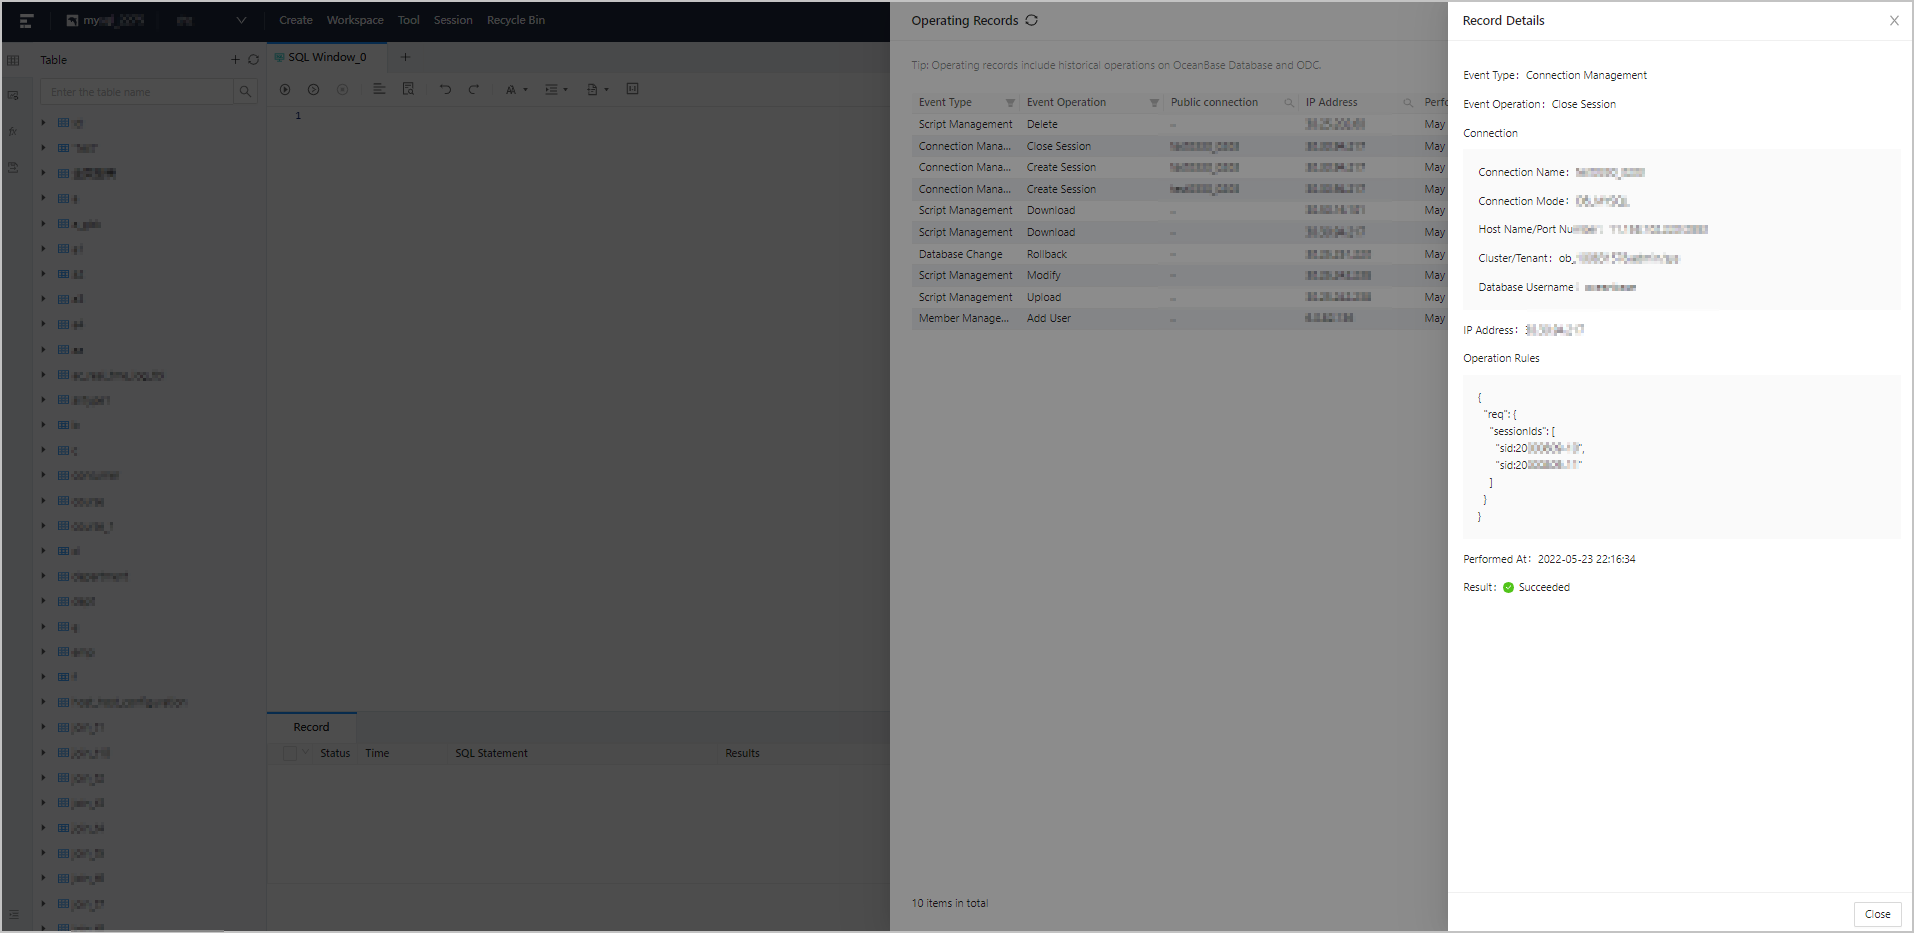
In the operation record list, click View in the Actions column. The Record Details panel appears.

You can view the details of the record in the following columns: Operation Type , Event Operation , IP Address , Operation Rules , Performed At , and Result .
Related information
For more information about how to manage the operation records, see Manage operation records in the chapter for the public resource console.

