


On the Database Management page of OceanBase Developer Center (ODC), click Workspace in the top navigation bar and click SQL Window in the drop-down menu that appears.
The SQL window provides an SQL editing area for editing scripts, an execution record tab, and a result tab for displaying the execution results. The SQL window also supports executing PL statements.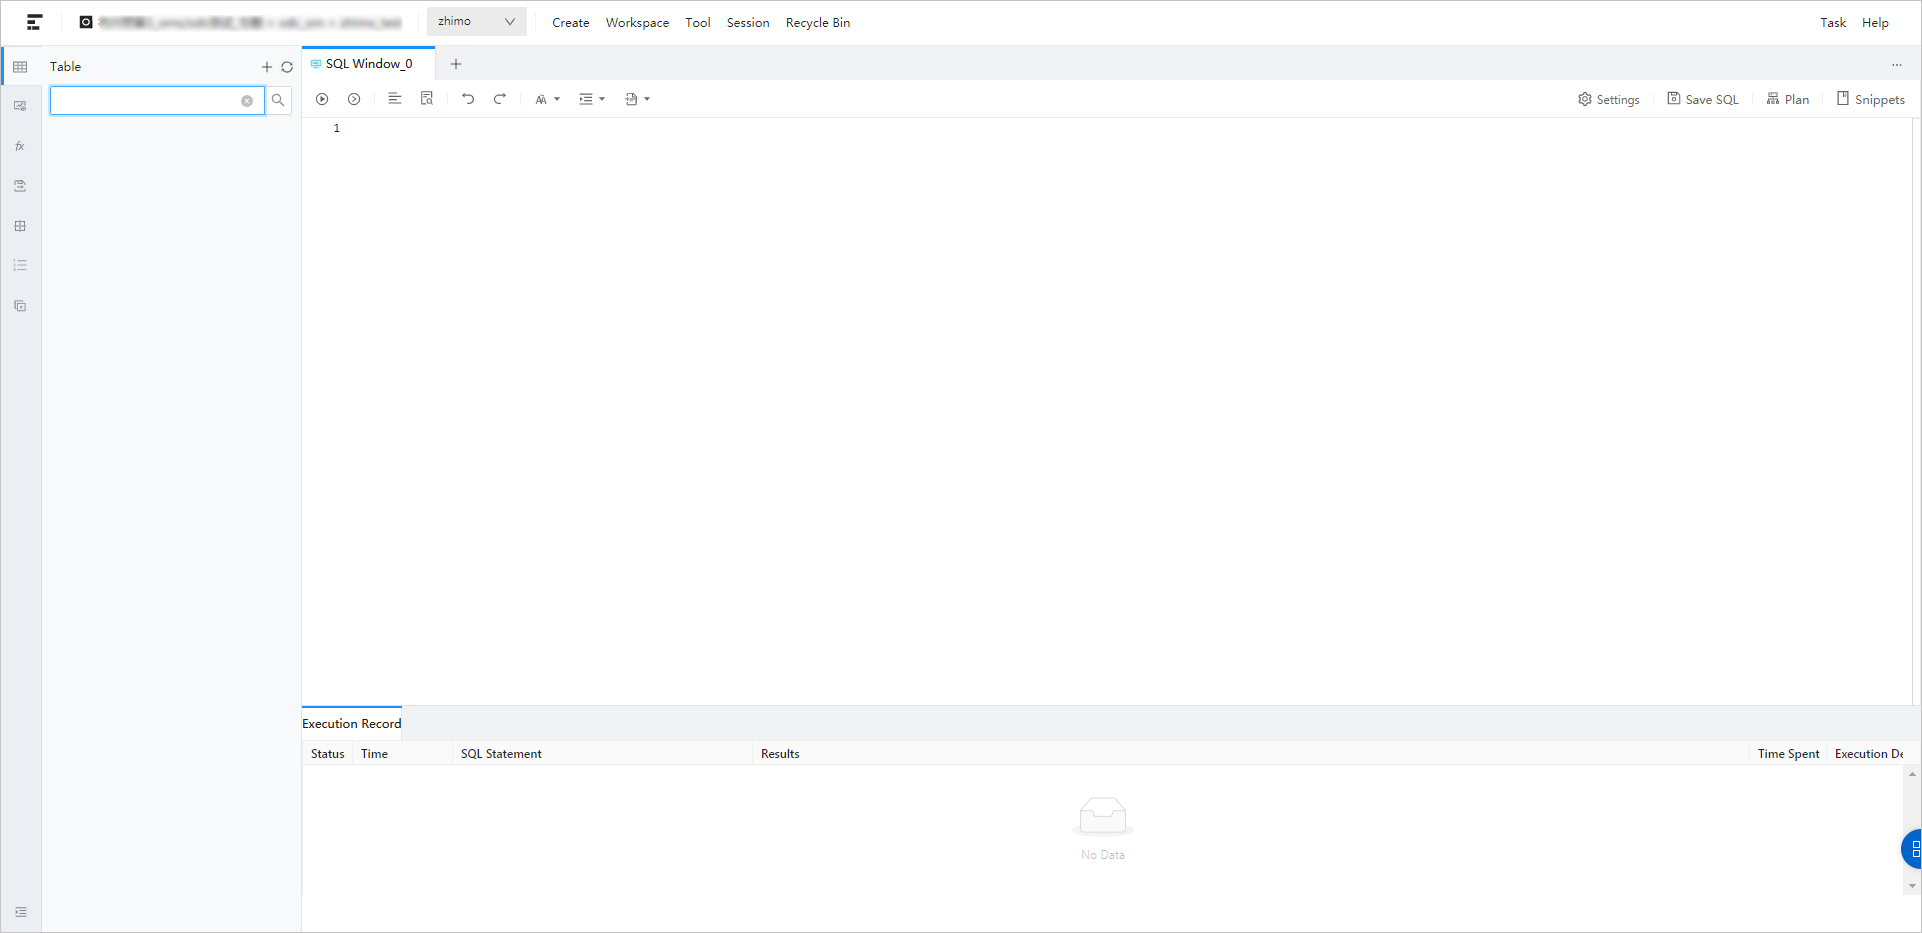
SQL editing area
The SQL editing area provides many features for you.
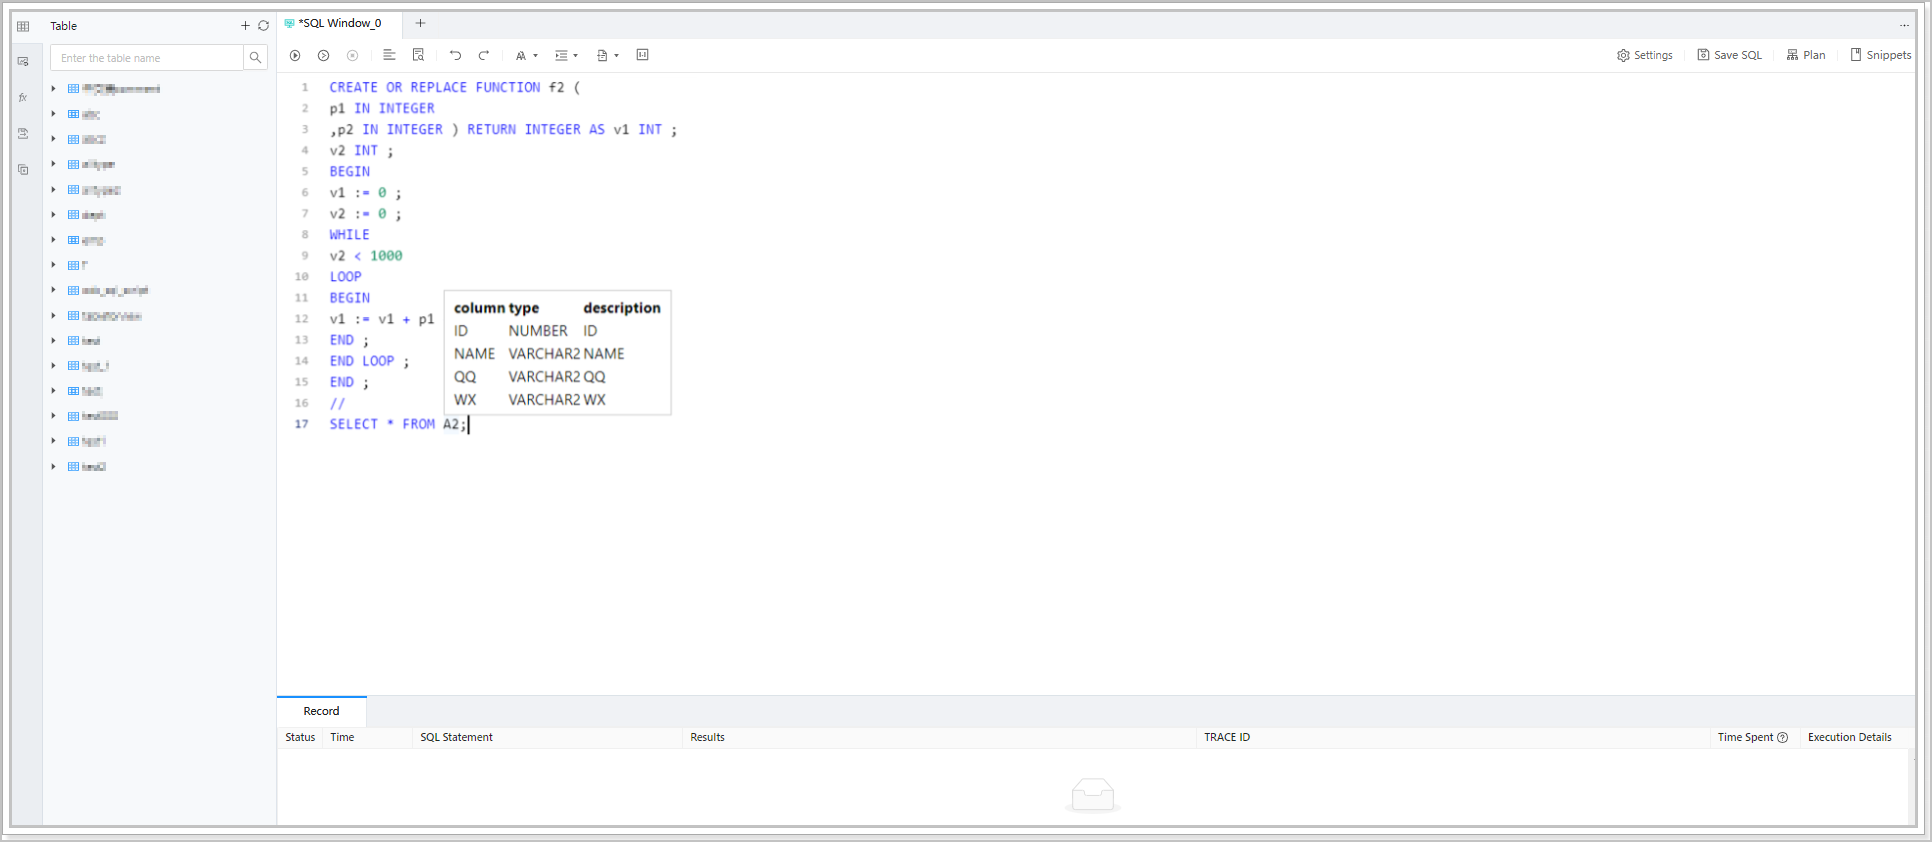
Database keywords are highlighted in different colors.
When you right-click the name of a table, view, or function in a
SELECTstatement, some common operations are displayed. When you place the pointer over the name of a table, the field information is displayed.You can directly drag objects from the object list into an SQL statement in the SQL editing area to fill in an object name in a statement.
The SQL editing area provides the auto-complete feature to improve your SQL statement editing efficiency.
Special symbol abnormality can be identified in the editing area of the SQL window, where abnormal symbols are marked with yellow wavy underlines.
Note
In ODC, multiple identical connections share one single session. The auto commit feature of ODC in Oracle mode is enabled by default. If you want to manually commit transactions, you can modify the value of the
autocommitvariable on the Session Properties page. For more information, see Session management.In manual-commit mode, make sure to set
ob_trx_idle_timeoutto a value greater than the timeout value of SQL queries. Otherwise, if two SQL statements in one transaction are executed at an interval longer than the value ofob_trx_idle_timeout, the connection will be terminated. However, ifob_trx_idle_timeoutis set to an excessively large value, the session cannot be released in time, resulting in unnecessary memory consumption. Therefore, you need to set this parameter to a proper value.
In addition to the preceding features, the toolbar of the editing area provides the following buttons.
| Button | Description |
|---|---|
| Run | Click this button to execute all the SQL statements in the current window. This button is disabled if an SQL statement is being executed in another window of the same session. |
| Run Current Statement | Click this button to execute all the selected SQL statements or the SQL statement in the line where the pointer is located. This button is unavailable if an SQL statement is being executed in another window of the same session. |
| Commit | Auto-commit is turned off by default in Oracle mode, so you need to click this button to commit the current transaction. After you click this button, a dialog box appears, indicating that the current connection uses a shared session and the commit will apply to all windows. Click Yes to commit the transaction. In MySQL mode, auto-commit is turned on by default, so this button is not displayed. This button is unavailable if an SQL statement is being executed in another window of the same session. |
| Rollback | Auto-commit is turned off by default in Oracle mode. You can click this button to roll back the current transaction. After you click this button, a dialog box appears, indicating that the current connection uses a shared session and the rollback will apply to all windows. Click Yes to roll back the transaction. In MySQL mode, auto-commit is turned on by default, so this button is not displayed. This button is unavailable if an SQL statement is being executed in another window of the same session. |
| Abort | Click this button to abort the statement that is being executed. |
| Format | Click this button to apply formatting, such as indentation, line break, and keyword highlighting, to the selected SQL statements or all the SQL statements in the current SQL window. |
| Find and Replace | You can enter text in the search field to find the specific content and enter text in the replacement field to replace the content found. |
| Undo | Click this button to undo the last operation. |
| Redo | Click this button to reverse an Undo operation. |
| Case Sensitivity | The system supports three configurations: All Uppercase , All Lowercase , and Capitalize First Letter . Click the corresponding button to convert the selected statements in the script to the corresponding capitalization format. |
| Indent | You can add indents to or delete indents from the statements that you selected. |
| Comment | You can click Add Comments to convert the statements that you select into comments or click Delete Comment to convert comments to SQL statements. |
| IN Value Conversion | Click this button to convert the copied rows or columns into the specified format during queries. After you paste the copied data to the SQL editing area, select the copied data and click IN Value Conversion to convert it into the in('A','B') format. * Column values are separated with line breaks. * Row values are separated with spaces or tabs. |
| Settings | * Delimiter : Select the sign that you want to use as the delimiter from the drop-down list. Five types of delimiters are supported: semi-colons ( ; ), slashes ( / ), double slashes ( // ), dollar signs ( $ ), and double dollar signs ( $$ ). * Query Result Limit : allows you to set the maximum number of lines that a query can return. Default value: 1000. |
| Save | Click this button to save the script in the current window. You can open a saved script when you enter the workspace again. You can view only the SQL scripts saved by yourself. The script names must be unique. After you open a saved script, you can continue to edit it. |
| Execution Plan | Click this button to view the execution plan for the SQL statement that you select or on which the pointer is located. This execution plan is estimated by the system before execution and is the result of the EXPLAINPLAN operation. Therefore, the execution data displayed may differ from the actual execution data. You can use this feature to evaluate SQL statements. Click Execution Plan . On the Plan Details tab, click View Formatting Info to switch to the formatting view. |
| Snippet | Click this button to view and reference built-in and custom code snippets. For more information, see Snippet. |
Execute a PL statement
You can edit a PL statement in the SQL window. Before that, you must specify a delimiter and write a PL statement in the editing area. End the PL statement with the specified delimiter.
At present, you can use the following methods to specify a delimiter in ODC:
Click Settings in the toolbar of the SQL editing area. In the window that appears, select the required delimiter in the Delimiter field.
On the Personal Settings page, select a required delimiter in Delimiter Settings .
In ODC V2.4.1 and later, you can use the
DELIMITERstatement in the editing area to define a delimiter. In Settings , the Delimiter field displays the delimiter that you specified.
After you execute the PL statement in the SQL window, the result tab displays the database management system (DBMS) output.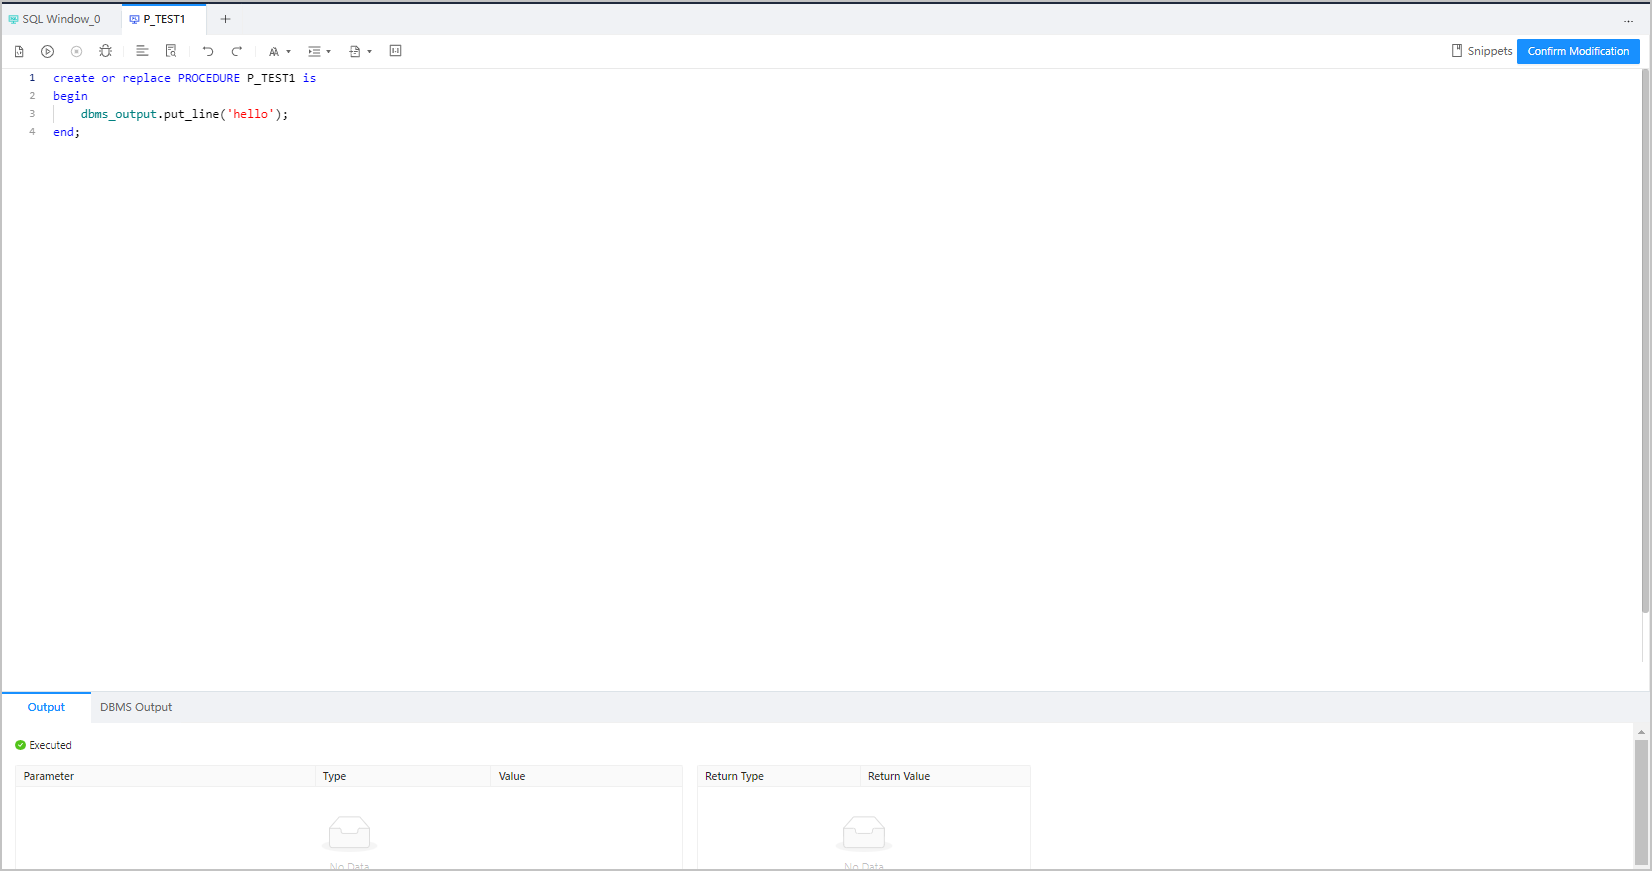
Execution Record tab

On the Execution Record tab, you can view the history of SQL statements executed in the current connection. You can view the information in the following fields: Status , Time , SQL Statement , Results , Trace ID , Time Spent , and Execution Details . The execution details is the execution plan.
| Field | Description |
|---|---|
| TRACE ID | The ID of the execution record. Notice If TRACE ID is empty, make sure that the enable_sql_audit and ob_enable_trace_log parameters are set to ON when the statement is executed. 1. Choose Session> Session Properties > Session Variable and search for the enable_sql_audit and ob_enable_trace_log parameters separately. 2. Click OFF in the list of values and then click the Edit icon. In the dialog box that appears, select ON and then click OK. 3. Enable system parameters: sql obclient> alter system set enable_sal_audit='True'; Query OK, 0 rows affected (0.06 sec) |
| Time Spent | Time Spent of an SQL statement in ODC is divided into the following three parts: * Network time spent: the time consumed to transmit the SQL statement over the network. * ODC time spent: the time consumed to process the SQL statement by ODC. * Database time spent: the time consumed to process the SQL statement by the database. You can move the pointer over the icon next to Time Spent . The time spent on executing an SQL statement is displayed in three sections in the tooltip. |
| Execution Details | By default, the execution plan is displayed in text. In the Execution Details column, click View . The Execution Details page displays the basic information, time spent, I/O statistics, and executed SQL statements. |
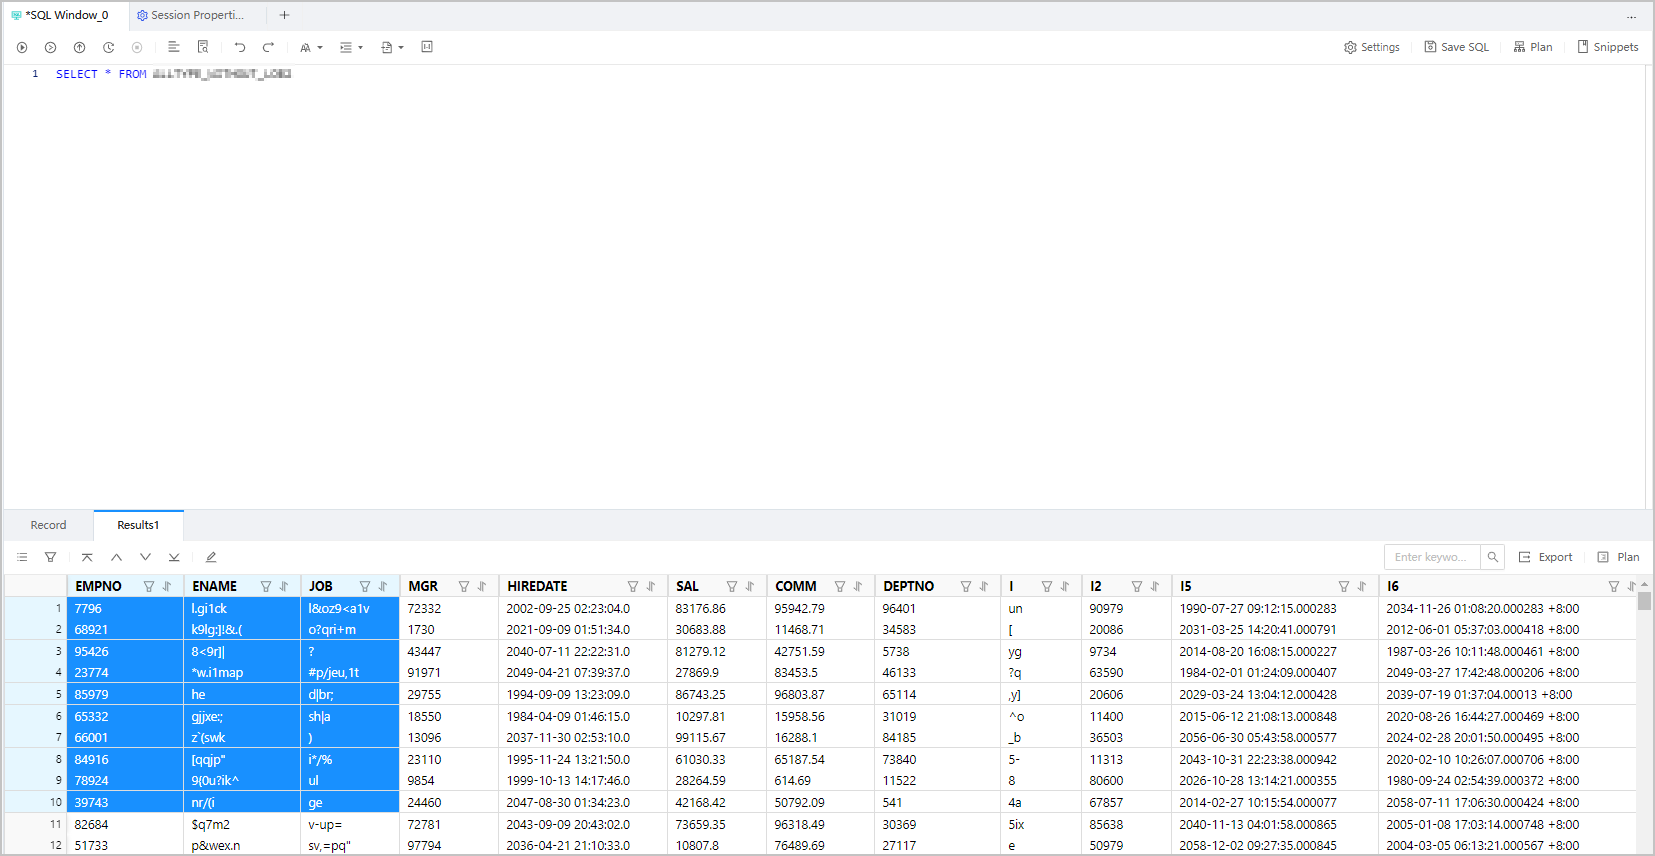
Results tab
You can view the execution result of the current SQL statement on the Results tab. The result set on the Results tab can be used in communication to facilitate daily development work:
You can select the required data of a result set and copy the data to an external file by using hotkeys. You can also click a field name or row number to select an entire row or column. You can also click Export in the toolbar to export data of a result set to a local file.
Right-click a cell and choose Copy from the context menu to copy data to an external file.
If the data in a cell is too long and cannot be fully displayed, you can place the pointer over the cell and click the zoom-in icon at the end of the cell. In the window that appears, view the data in full.
You can right-click the tab name (for example, Result 1) of a result tab and choose Fixed to pin it, so that it remains displayed. In this way, when you execute a new query, a new result tab appears but does not overwrite the pinned result tab. This allows you to compare the query results. Click Unpin to unpin a result tab.
Each field name in the result set is provided with a filtering icon and a sorting icon. You can use them to filter and sort data of a single column.
You can adjust the order of fields by dragging column names in a result set.
The toolbar in the navigation bar of the Results tab also provides the following buttons:
| Button | Description |
|---|---|
| Column Mode | Click this button to display the selected data row in the form of a table. On the Column Mode page, you can switch to the previous or next row. Column Mode makes it easier to view data in a row that has many columns. To view data in column mode, perform the following steps: 1. Select the data you want to view and click  Column Mode . 2. On the Column Mode page, click the left or right arrow to switch between the column values of adjacent rows. 3. Move your pointer over a column field and click the Column Mode . 2. On the Column Mode page, click the left or right arrow to switch between the column values of adjacent rows. 3. Move your pointer over a column field and click the  button to view the field details. button to view the field details. |
| Columns | Click this button to select the columns to be displayed on the page. |
| Back to Start | Click this button to go to the first page. |
| Previous | Click this button to go to the previous page. |
| Next | Click this button to go to the next page. |
| Jump to Bottom | Click this button to go to the last page. |
| Edit | Click Edit to enable editing mode for the current result set. The editing mode supports the following operations: Add , Copy Current Row , Delete , Cancel , Confirm Modification , which submits a transaction when auto-commit is turned on, and Modify and Submit , which is displayed when auto-commit is turned off. In the editing mode, you can either double-click target data to directly modify it or click the preceding buttons for convenient operations. When you edit a cell, you can right-click the cell and select Copy or Set to Null from the context menu to operate on the cell. Note The ResultMetaData is obtained during the execution of an SQL statement to indicate whether the result set can be edited. * If the result set cannot be edited, the Edit button is hidden and a prompt is displayed indicating that the result set cannot be edited. * If the result set can be edited, the Edit button is available and you can click it to go to the result set editing page. You can edit result sets in single-table and single-view queries. * However, result sets that involve the SET and ENUM fields cannot be edited. |
| Export | To export the result as a CSV or an SQL file, specify a File Type and Character Set ( GBK or UTF8 ). |
| Plan | Click this button to view the actual resource consumption and execution plan of an executed SQL statement. This allows you to evaluate the performance of the statement. |