


This topic describes how to use a performance report. A performance report provides you with information about the cluster load, performance, and SQL statements within a specified period of time, and helps you learn the cluster running status and troubleshoot performance-related problems.
Introduction
OceanBase Cloud Platform (OCP) can generate cluster performance reports. The Reports list on the Performance Reports page contains the following columns: Report Name , Snapshot Start Point , Snapshot End Point , Created By , Status , Generated At , and Actions. The Actions column provides the View Report and Download Report options.
You can sort the reports by Snapshot Start Point , Snapshot End Point , and Generated At .
You can filter the reports by Generation Status .
Generate a performance report
Log on to the OCP console. In the left-side navigation pane, click Clusters .
Find the target cluster in the Clusters list and click the cluster name. The Overview page appears.
In the left-side navigation pane, click Performance Report to go to the performance report details page.
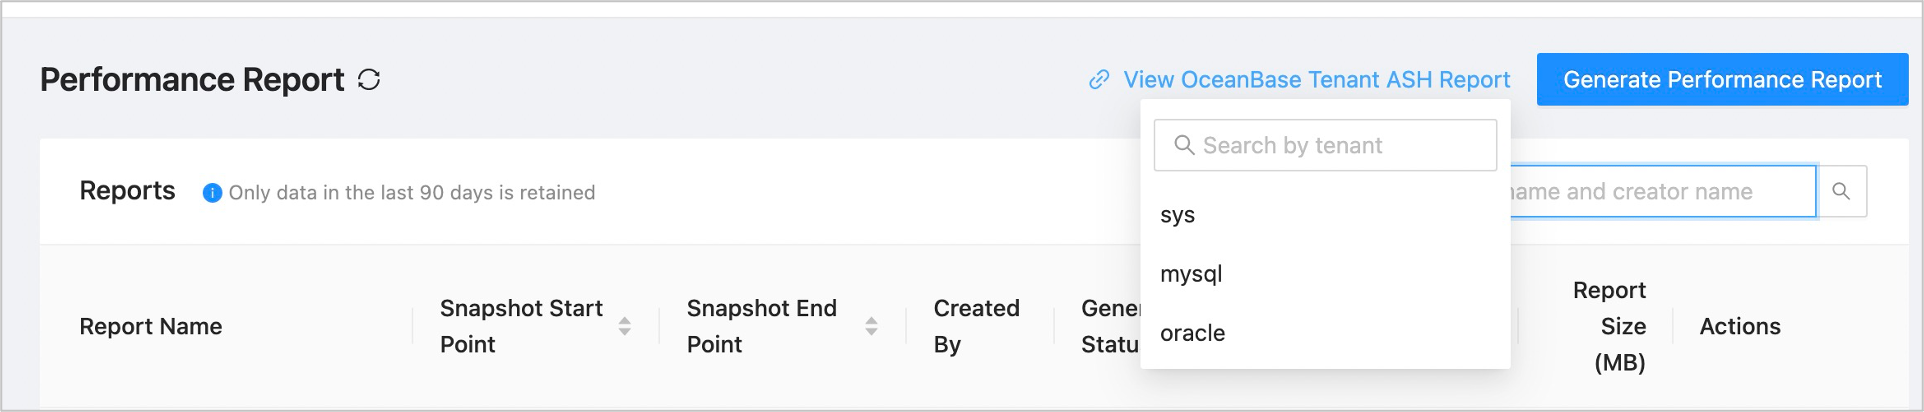
Click Generate Performance Report in the upper-right corner on the page that appears.
In the dialog box that appears, set the following parameters.
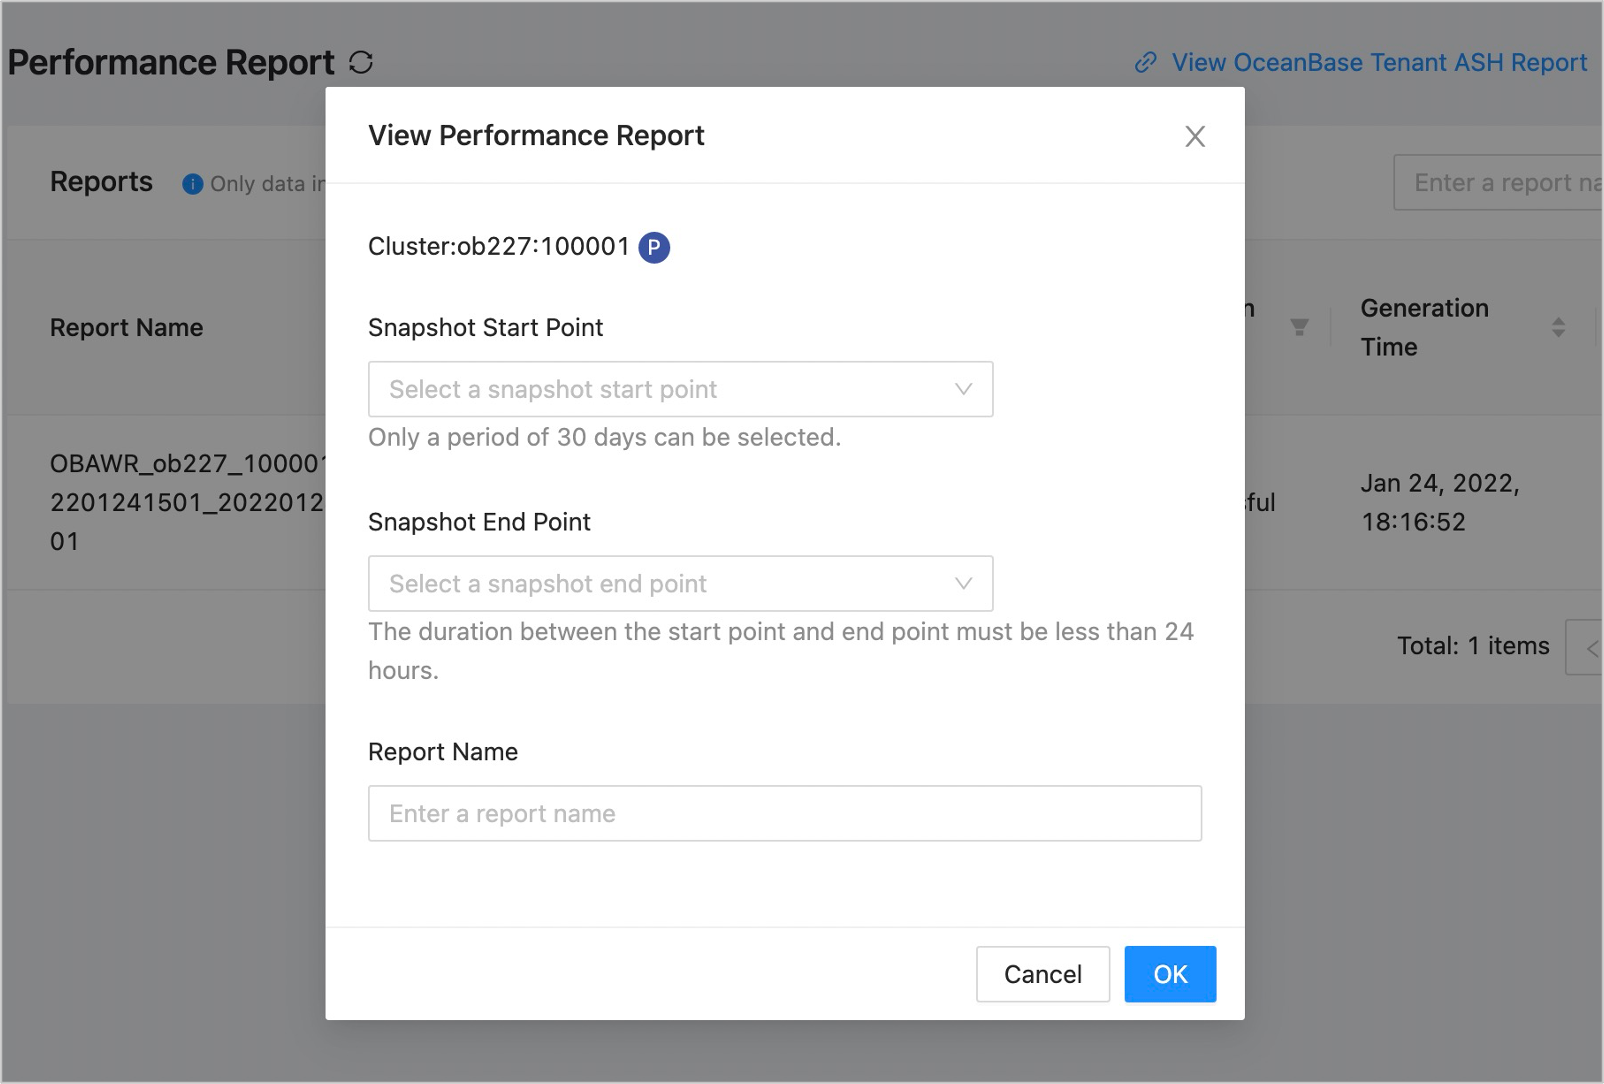 ParameterDescription
Report Name Required. The name of the report. Snapshot Start Point You can select only a point in time in the past 30 days. The available points in time are fixed and cannot be customized. Snapshot End Point You can select only a point in time within 24 hours after the Snapshot Start Point. The available points in time are fixed and cannot be customized. If the SQL monitoring data of a tenant is abnormal in the performance report, select the tenant from the View OceanBase Tenant ASH Report drop-down list to go to the ASH Report page of the tenant.
Click OK . A report is generated for the performance between the snapshot start point and the snapshot end point. You can view the report in the Reports list and download it.
View and download a report
OCP shows a list of performance reports generated in the last 90 days.
To view a performance report, click View Report in the Actions column.
To download a performance report in the .html format, click Download Report in the Actions column.
You can view the following information in a performance report:
Basic information
ParameterDescriptionBasic Cluster Information Includes the cluster version, cluster type, number of hosts, number of tenants, and start time and end time of the last major compaction. Note
If the version of the OceanBase Database is V4.0 and later, viewing merge-related information is not supported.Node Basic Information Includes the host IP address, zone, availability of Root Server, status, service start time, and time of last deletion. Node Resources Includes the host IP address, zone, total CPU cores, allocated CPU cores, allocated CPU resources in percentage, total memory in MB, allocated memory in MB, allocated memory in percentage, disk usage in GB, and disk usage in percentage. Node Partitions Includes the host IP address, zone, associated tenants, number of partitions, and number of leader partitions. Note that the number of partitions includes the number of leader partitions. Note
If the version of the OceanBase Database is V4.0 and later, viewing node data partition information is not supported.Tenant Resources Includes the tenant name, tenant ID, tenant type, resource unit configuration, zone priority, locality, and list of servers. Tenant Capacity Includes the associated tenants, tenant ID, associated hosts, and data capacity. Workload Statistics: The table includes the following columns: Metrics , Cumulative Value , Start Value , End Value , Maximum Value , Maximum Value Occurred At , Minimum Value , Minimum Value Occurred At , and Average Value . For more information about monitoring metrics, see Monitoring Metrics.
Wait Event Statistics: You can view the Top10 waiting events with the cumulative waiting time of cluster and tenant-wide content, including Event Name, Event Category, Total Latency (ms), Total Delays, and Total Timeouts.
Routing Statistics: You can view routing statistics under the tenant, including Route Hit Rate (%), Route Hits, and Route Misses.
SQL Statistics
ParameterDescriptionSQL Sorted by Total Response Time - Top 10 SQL statements with the longest response time in the cluster.
- Top 10 SQL statements with the longest response time in the tenant.
SQL Sorted by CPU Time - Top 10 SQL statements with the longest CPU time in the cluster.
- Top 10 SQL statements with the longest CPU time in the tenant.
SQL Sorted by I/O Latency - Top 10 SQL statements with the longest I/O wait time in the cluster.
- Top 10 SQL statements with the longest I/O wait time in the tenant.
SQL Sorted by Network Latency - Top 10 SQL statements with the longest network latencies in the cluster.
- Top 10 SQL statements with the longest network latencies in the tenant.
SQL Sorted by Logical Reads - Top 10 SQL statements with the most logical reads in the cluster.
- Top 10 SQL statements with the most logical reads in the tenant.
SQL Sorted by Physical Reads - Top 10 SQL statements with the most physical reads in the cluster.
- Top 10 SQL statements with the most physical reads in the tenant.
SQL Sorted by Executions - Top 10 most executed SQL statements in the cluster.
- Top 10 most executed SQL statements in the tenant.
SQLs Sorted by Number of Remote Plan Executions - Top 10 most executed SQL statements in the cluster.
- Top 10 most executed SQL statements in the tenant.
SQLs Sorted by Distributed Plan Executions - Top 10 most executed SQL statements in the cluster.
- Top 10 most executed SQL statements in the tenant.
SQL Sorted by Affected Rows - Top 10 SQL statements affected most rows in the cluster.
- Top 10 SQL statements affected most rows in the tenant.
SQL Texts Displays the information of all the preceding SQL statements. Memory Statistics: You can view the memory statistics of tenants under the cluster, including Context ID, Memory Usage (Bytes), Average Memory Size Per Object (Bytes), Maximum Memory Usage (Bytes), Period with Maximum Memory Usage, Minimum Memory Usage (Bytes), and Period with Minimum Memory Usage.
Cache Statistics
This module provides the average KV cache hit rate of tenants. The statistic data source is the OceanBase view gv$systat. The hit rate is accurate to two decimal places.
You can view the statistics of the following 7 types of caches: Block Cache, Block Index Cache, Clog Cache, Clog Index Cache, BloomFilter Cache, Location Cache, and Row Cache. The following statistics are displayed: cache hit rate, cache requests, and cache size.
Note
In the statistic report, you can move the pointer over a parameter in the table header to view the parameter description.
ParameterDescriptionCache Hit Rate The hit rates of different types of caches in different tenants in the snapshot period. For more information about the cache types, see Caching. Cache Request Information about caches and cache requests in different tenants in the snapshot period, such as the number of cache requests, cache hits, and cache mishits. Cache Size The size of different types of caches in different tenants in the snapshot period. The start and end positions are displayed.
RPC Statistics
Note
In the statistic report, you can move the pointer over a parameter in the table header to view the data source of the parameter.
ParameterDescriptionTotal RPCs The number and size of RPCs, RPC latencies, and the number of failed RPCs collected in dimensions of tenant and host. Sort RPCs by RPC size and display the Top 10 results. Package Code RPC Sort RPCs by package code and display the Top 10 results. Clog RPC Information about Clog RPCs collected in dimensions of tenant and host, such as the number of all Clog RPCs and successful Clog RPCs, and total time consumed by successful Clog RPCs. GTS RPC The number of GTS RPCs collected in dimensions of tenant and host. Location Cache RPC Information about Location Cache RPCs collected in dimensions of tenant and host, such as the number of all cache refreshes, cache refreshes by RPCs, and failed cache refreshes by RPCs. Lock Statistics
ParameterDescriptionRow Lock Statistics The number of applications, waits, and timeouts, and wait time of row locks in a tenant. Latch Statistics You can view the following statistics on latches in a tenant: - Get: indicates the number of successful willing-to-wait latch requests.
- Miss: indicates the number of failed willing-to-wait latch requests.
- Sleep: indicates the number of failed willing-to-wait latch requests that result in process sleeps.
- Spin Get: indicates the total number of spins in the tenant.
- Immediate Get: indicates the number of successful immediate latch requests.
- Immediate Miss: indicates the number of failed immediate latch requests.
Parameter Changes
This module provides information about the changes of the parameters collected in dimensions of cluster, zone, server, and tenant in the snapshot period.