This topic describes how to query traces whose execution time exceeds a specific period of time on the Link query page of OceanBase Cloud Platform (OCP). You can use the SQL ID of an abnormal SQL statement in SQL diagnostics or the SQL trace ID of an abnormal log on the log query page to query the detailed information about a trace. You can query the details of a trace and use the trace data to locate and rectify exceptions.
Background
OceanBase Database is a distributed database management system. A database request or transaction may be processed across multiple OceanBase Database instances. In a typical distributed deployment architecture, OBProxy and database drivers, such as JDBC driver and libobclient, are also involved. In this case, a database request is sent from the database driver to the OBProxy and then executed by one or more OceanBase Database instances, which uses network links. The complexity of traces makes it difficult to locate exceptions and performance issues.
To solve the preceding issues, OceanBase Database provides the full-link diagnostics feature. This feature allows OceanBase Database and OBProxy to record in trace logs the upstream and downstream instances of a trace, and context and execution duration of key steps. OCP collects, processes, and stores these logs, and allows you to search for and view traces. You can search for traces based on specified conditions and view the details of a trace to locate an issue. For more information, see Experience full link diagnosis.
Prerequisites
- You have the read-only permission on the objects in the queried trace.
- An OpenSearch cluster is deployed. For more information, see About OpenSearch.
- Parameters related to trace query are configured. For more information, see Configure trace query parameters.
- Trace query is supported only in tenants of OceanBase Database V4.0 and later.
Procedure
Log on to the OCP console.
In the left-side navigation pane, click Log service to go to the corresponding page.
Click the Link query tab.
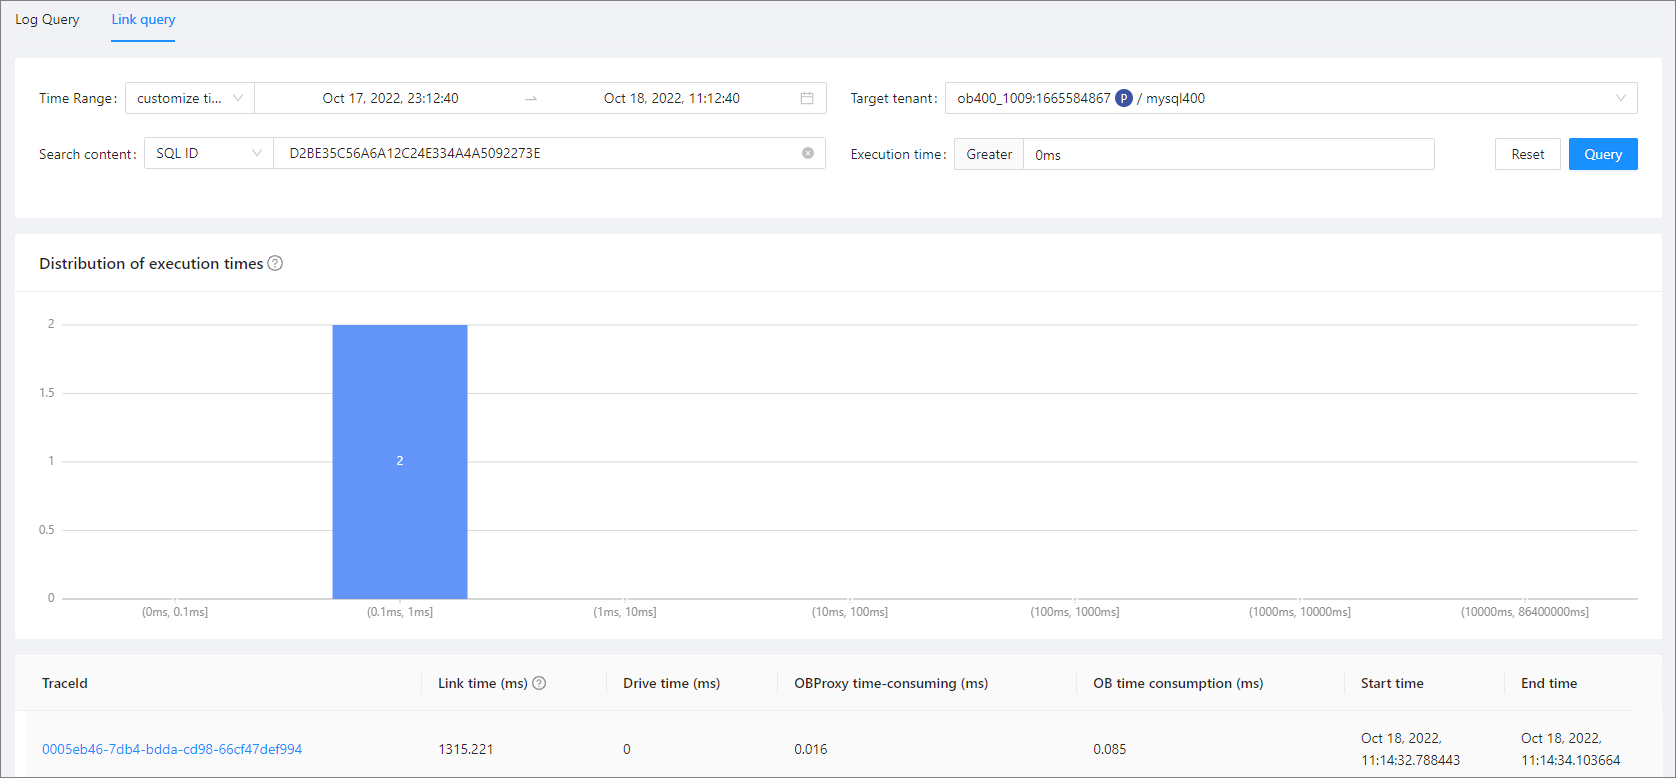
On the Link query tab, specify search conditions as needed to retrieve the desired traces.

The following table describes the fields of the search conditions.
Field Description Time Range The default time range is last 1 hour. You can select a time range of last 5, 10, 15, or 30 minutes or last 1, 3, 6, 12, or 24 hours from the left-side drop-down list, or specify a custom time range in the right-side box. Target Tenant The tenant to be queried. You must specify this field. Search content Enter an SQL ID or SQL Trace ID. All traces under the specified ID are displayed. Execution Time Default value: 0 ms. You can set a duration to display traces whose execution time exceeds the specified duration. Click Query.
The query results are displayed in the lower part of the tab.

If you specify an SQL ID in the Search content field, you can view the distribution of the SQL execution duration and information of all involved traces.

If you specify an SQL Trace ID in the Search content field, you can view the information of this execution trace.

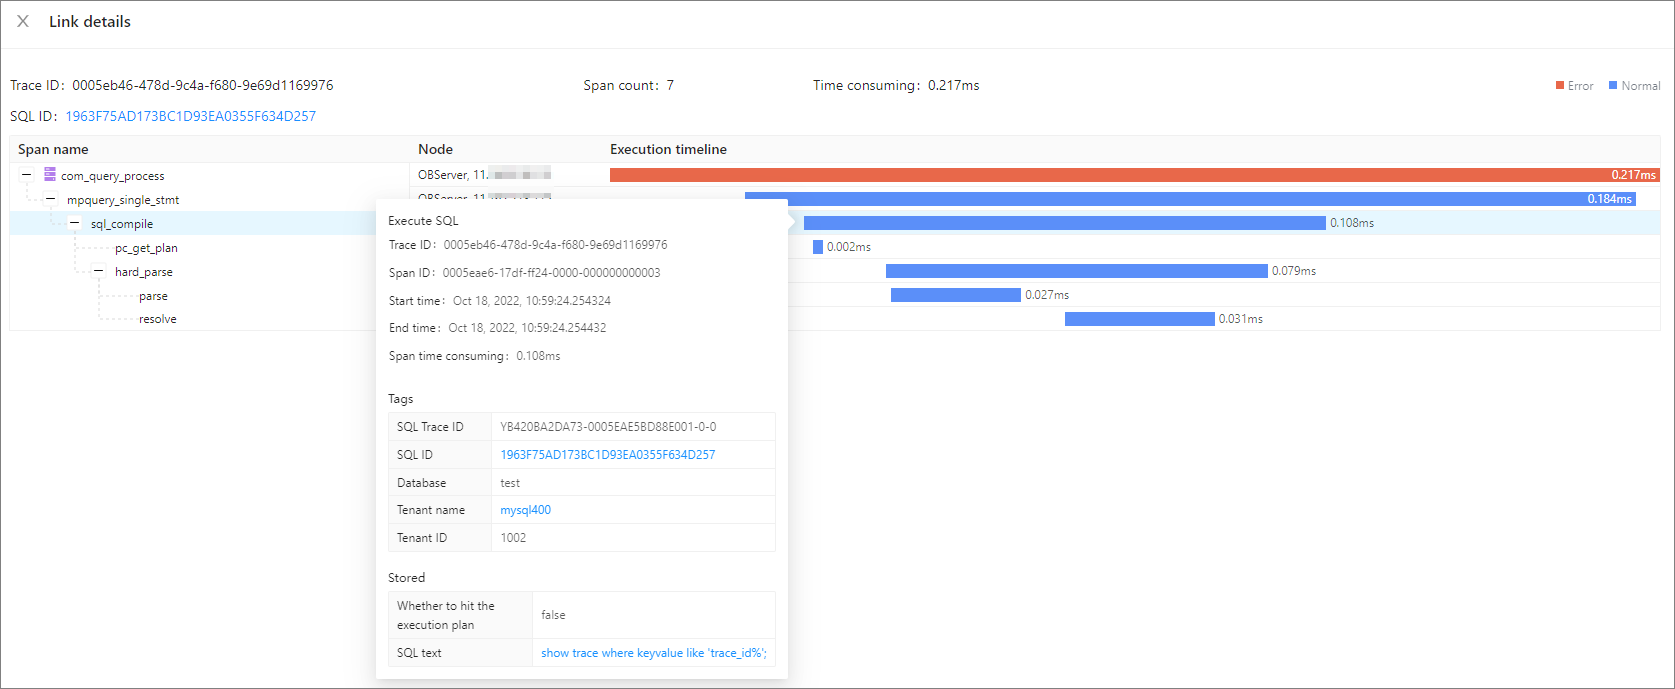
Click the trace ID in the TranceId column to view information about the trace and span details on the Trace Details page.
Hover the pointer over the timeline of a span to view details of the span in the tooltip.

Hover the pointer over the timeline of the
sql_compilespan. The tooltip that appears additionally displays the SQL ID of the SQL statement.You can click the SQL ID to view the running status, execution plan, bound indexes, and throttling status of the SQL statement on the SQL Details page. For more information, see View SQL statement details.

You can click the Trace SQL ID to view the SQL statement on the SQL Details page. For more information, see View SQL statement details.

