


This topic describes how to configure custom monitoring.
Scenarios
If the default GUI-based monitoring cannot meet your needs, you can configure custom monitoring.
Prerequisites
OceanBase Cluster Platform (OCP) has collected the required metrics but the GUI-based monitoring has not been configured.
Procedure
Go to the Custom Monitoring page
Log on to the OCP console.
In the left-side navigation pane, select Performance Monitoring to go to the Monitoring page.
Click Custom Monitoring in the upper-right corner.
Create a custom chart
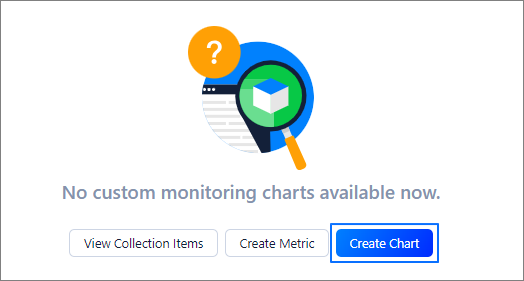
If you go to the Chart tab on the Custom Monitoring page for the first time, no custom charts are available. You can click Create Chart to create one.
On the Create Chart page, specify the parameters and click Save.
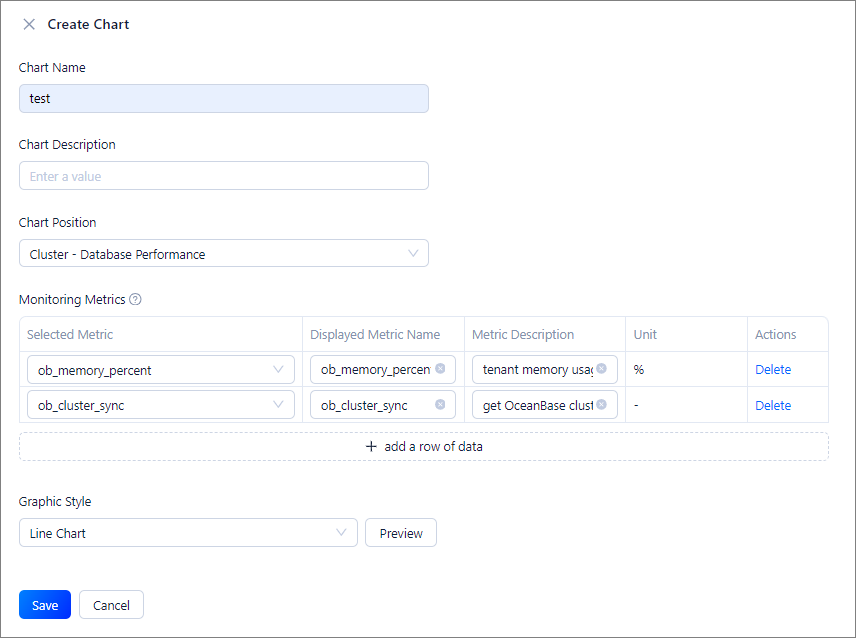
The parameters of a custom chart are described as follows:
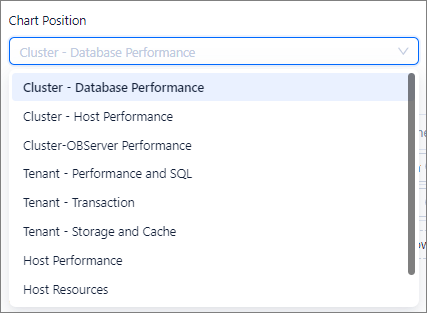
Chart Position: The valid values are monitoring subdirectories displayed on the GUI. Metrics supported in each subdirectory are different. For example, you can create only a cluster-related monitoring chart under a cluster-level subdirectory.
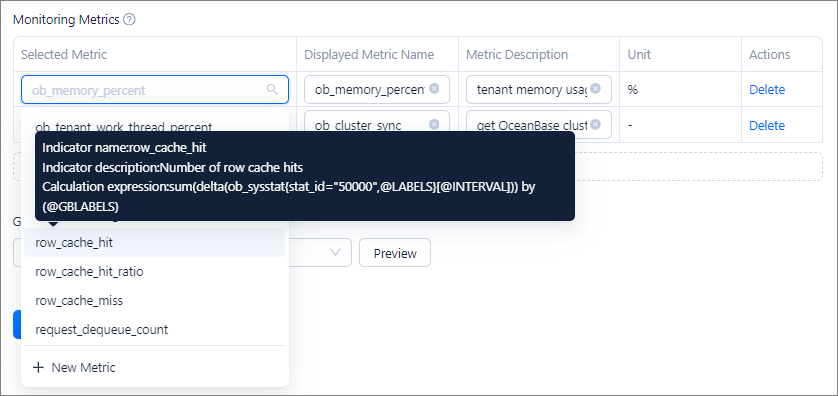
Selected Metric: Each metric corresponds to a PromQL expression. You can hover over a metric to view its name, description, and expression, as well as OceanBase Database versions that support the metric. If no specific OceanBase Database versions are displayed, the metric is supported in all versions.
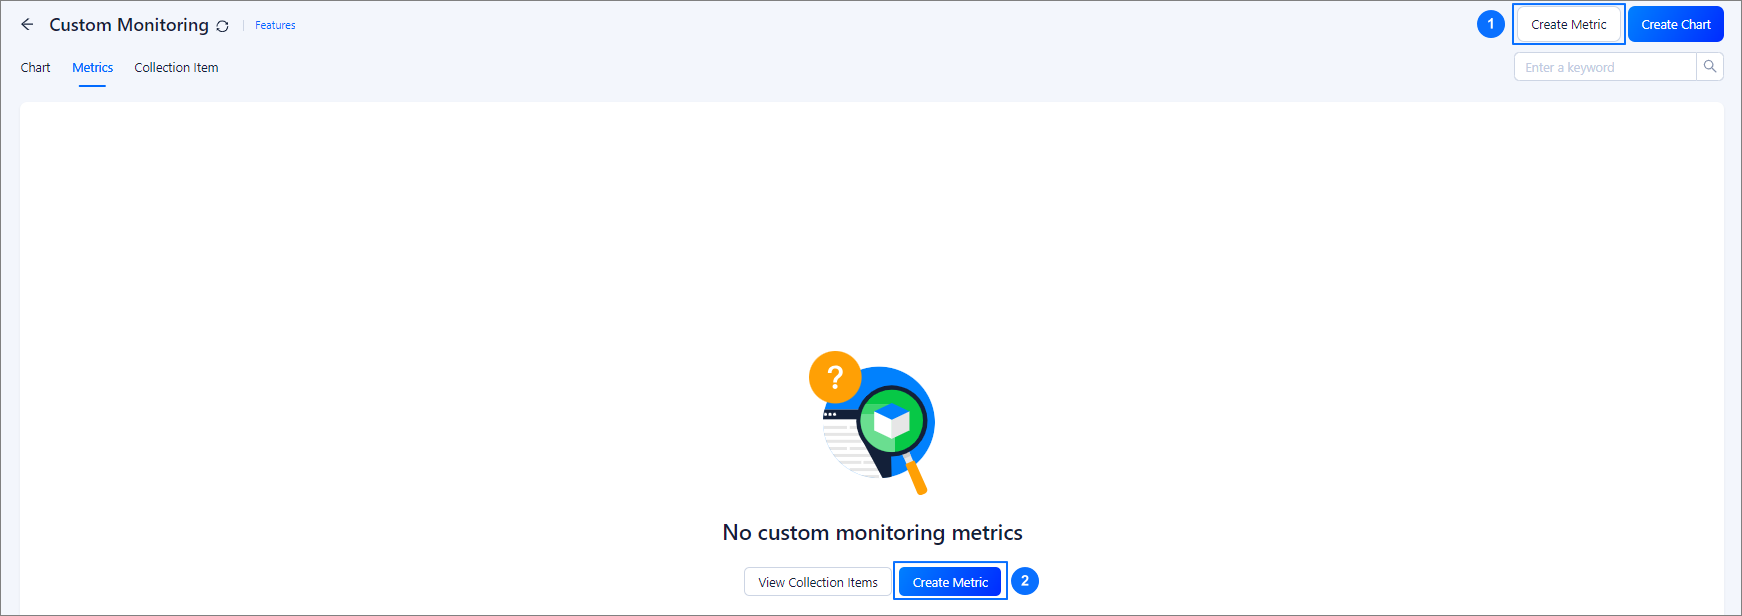
The default available metrics are built-in metrics in OCP and can be directly used. As shown in the following figure, you can click Create Metric in section ①, or click Create Metric in section ② on the Metric tab to create a custom metric based on your business.
Graphic Style: Only Line Chart is supported.
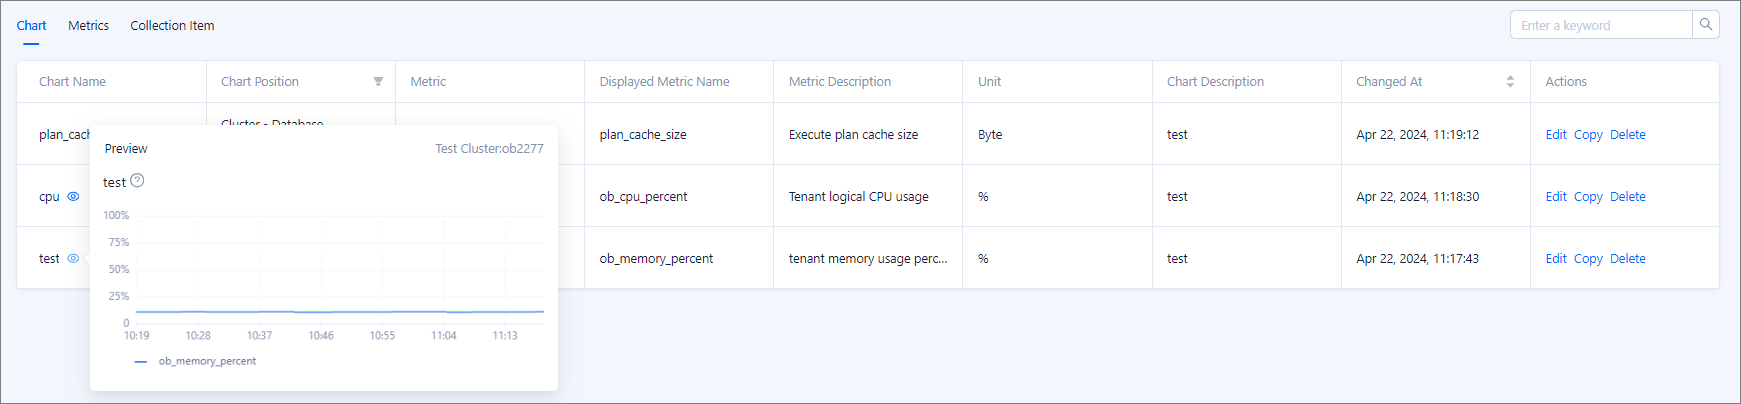
After you create a chart, you can view its information in the table on the Chart tab or directly view the chart at the position specified by Chart Position. By default, a new chart is sorted after existing ones.
Create a custom metric
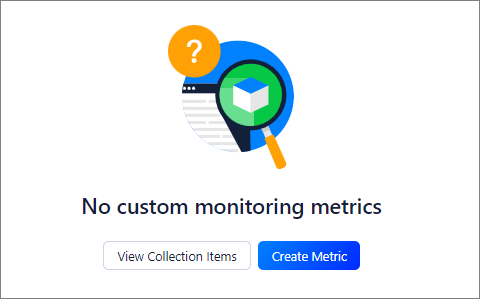
If you go to the Metric tab on the Custom Monitoring page for the first time, no custom metrics are available. You can click Create Metric to create one.
On the Create Metric page, specify the parameters and click Save.

The parameters of a custom metric are described as follows:
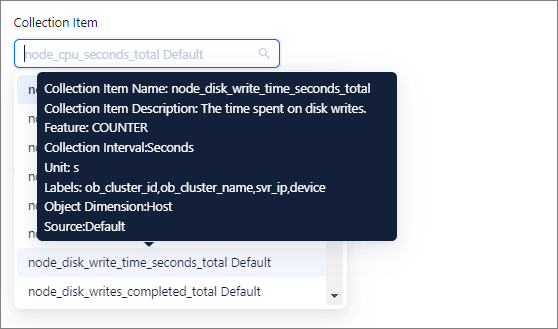
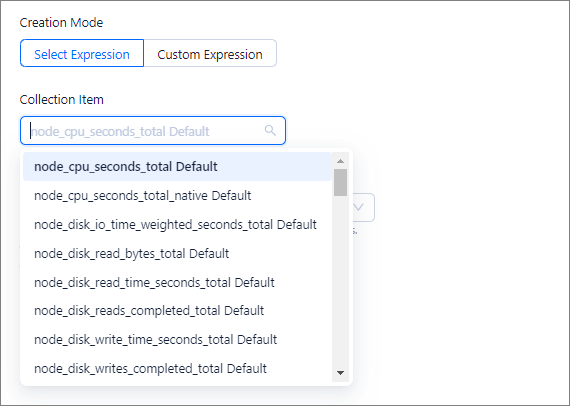
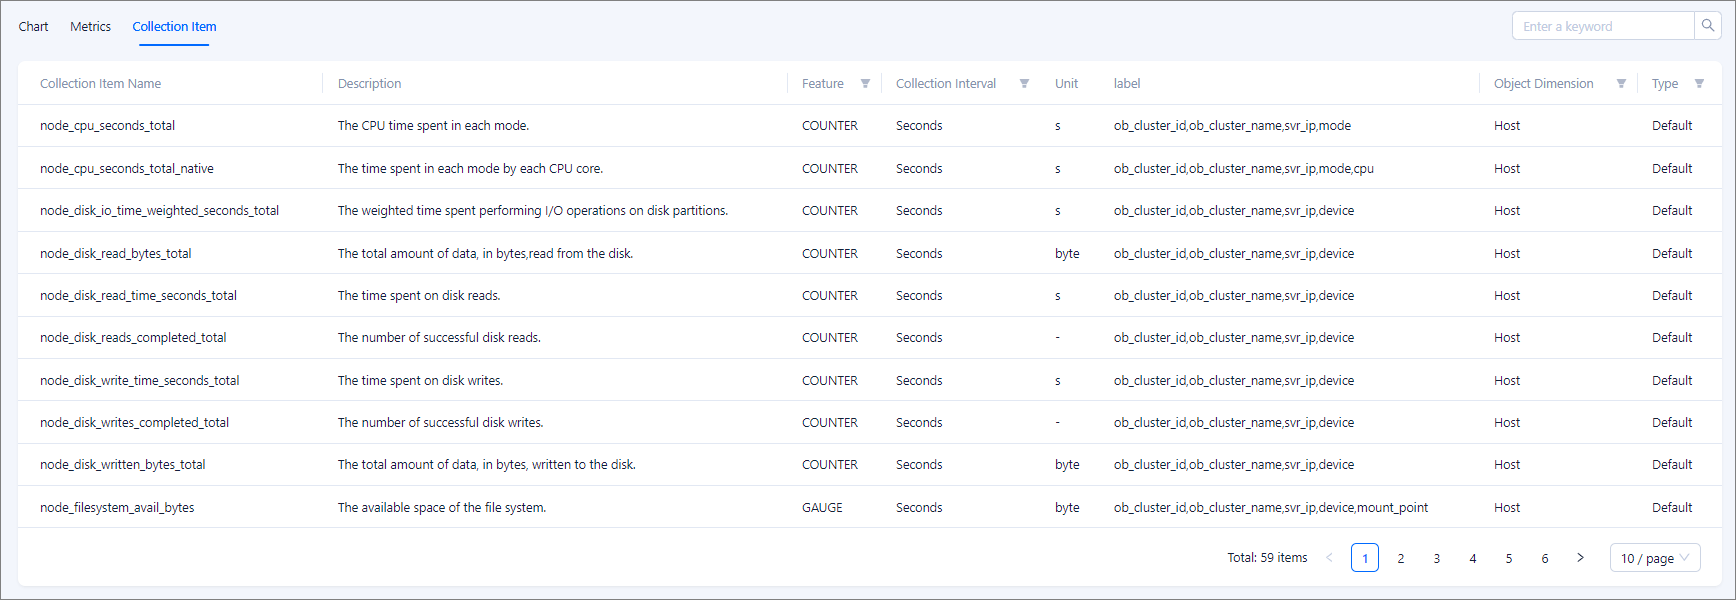
Collection Item: A collection item is a metric used in a PromQL expression. You can hover over a collection item to view its information, such as its name, description, type (COUNTER or GAUGE), collection interval, unit, label, and the object dimension.
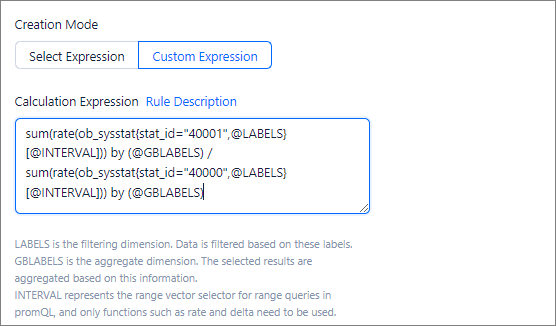
Creation Mode: Select Expression and Custom Expression modes are supported.
If you select Select Expression, you can select only a single collection item and a simple calculation expression that is provided based on the selected collection item.
If the default expressions cannot meet your needs, you can select Custom Expression and specify a custom PromQL expression. OCP verifies the PromQL syntax of the custom expression. You can view syntax rules below the text box of the calculation expression.
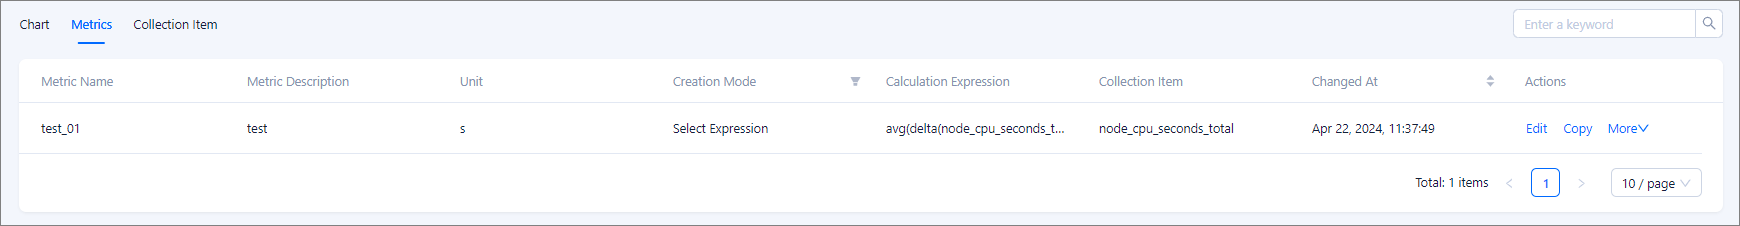
After you create a metric, you can view its information in the table on the Metric tab. Custom metrics can be used in custom charts.
Create an alert rule
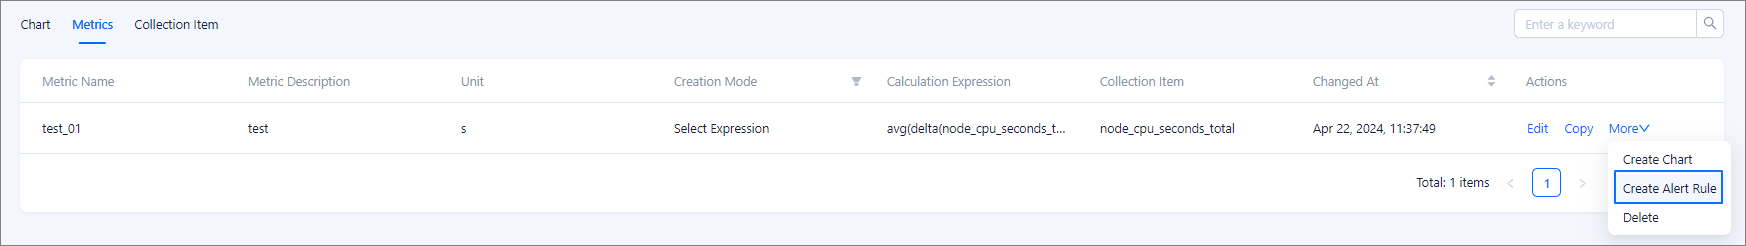
You can also use custom metrics to create alert rules. To do so, click Create Alert Rule to go to the alert rule creation page.
View collection item information
You can view information of all collection items supported by OCP on the Collection Item tab.
Note
OCP does not allow you to create a custom collection item on the GUI. If you need a custom collection item, contact OCP Technical Support.