


This topic describes how to view the running status of OBLOADER & OBDUMPER and troubleshoot issues. The status analysis and troubleshooting for the operating system and OceanBase Database are not described.
View the installation path of JDK
Step 1: View the installation path of JDK
Generally, you can install Java Development Kit (JDK) in the following ways:
Method 1: Download the JDK package and decompress it. Then, you can use JDK.
Method 2: Use the RPM package manager to install OpenJDK.
View the installation path of JDK installed by using method 1
Open the JDK package, which is ready to use out of the box, and view the root directory of the Java installation package. The following figure shows the details.
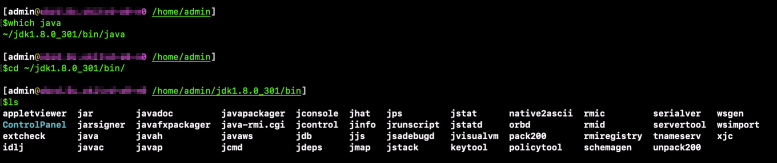
Run the
which javacommand to view the path where the Java program resides.Switch to the parent directory of the path where the Java program resides. Run the
lscommand to view the built-in tools.
View the installation path of JDK installed by using method 2
Perform the following steps to view the root directory of the Java installation package. The following figure shows the details.
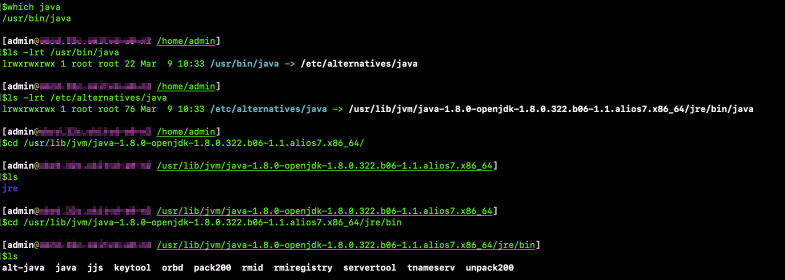
Run the
which javacommand to view the path where the Java program resides.Run the
ls -lrt /usr/bin/javacommand to view the soft link to thejavafile in the/etc/alternativesdirectory.Run the
ls -lrt /etc/alternatives/javacommand to view the soft link to thejavafile in the/usr/lib/jvm/java-1.8.0-openjdk-1.8.0.322.b06-1.1.alios7.x86_64/jre/bin/javadirectory.In the preceding figure,
/usr/lib/jvm/java-1.8.0-openjdk-1.8.0.322.b06-1.1.alios7.x86_64/jreis the root directory of the Java installation package. In this example, only Java Runtime Environment (JRE) is installed on the server. Therefore, thebindirectory does not contain tools such as jps, jstat, jmap, or jstack.
Step 2: Configure the JAVA_HOME environment variable
In the root directory of the Java installation package, configure the
JAVA_HOMEenvironment variable in the~/.bash_profileor/etc/profilefile.export JAVA_HOME={Root directory of the Java installation package} export PATH=$PATH:$JAVA_HOME/binSave the
~/.bash_profileor/etc/profileuser configuration file.Re-enter the CLI or run the
sourcecommand for the environment variable to take effect. Then, run thejava -versioncommand to verify whether JDK runs properly.
Note
- JDK is different from JRE. JRE provides only a runtime environment for Java. In addition to a built-in JRE, JDK provides a series of command-line tools such as jps, jstat, jmap, and jstack, which are usually located in the
{JAVA_HOME}/bin/directory. - If only JRE is installed on the server, you cannot use the built-in command-line tools of JDK.
View GC information
- The Java Virtual Machine Process Status (
jps) tool is a built-in JDK command for viewing Java processes.
jps
- The
jstat -gc pid interval countcommand is a built-in JDK tool for monitoring the resources and performance of Java applications.
jstat -gc Process ID 1000 1000
The following figure shows the monitoring metrics captured in real time.
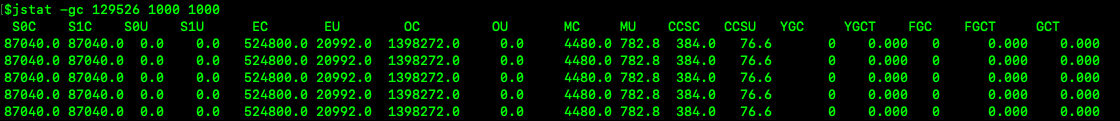
Focus on the FGC and FGCT metrics, which respectively describe the total number of full garbage collections (GCs) and total time consumed by the full GCs. Generally, if a full GC occurs during the running of an application, the memory resources may be insufficient. In this case, you can adjust the JVM memory parameter, which is set to -Xms4G -Xmx4G by default. A JVM crash or hanging issue may occur in some minor versions of OpenJDK 1.8. We recommend that you install OpenJDK of a version later than 1.8.0_3.x.x.
View the memory usage
Run the jmap -dump:format=b,file=./pid.hprof pid command to store the process memory status in the ./pid.prof file. Then use the MAT tool to analyze the status.
Note
In the command, pid indicates the process ID. Binary files are named after process IDs for ease of identification. Generally, you need to send the collected files to R&D engineers for analysis.
View the thread stack
jstack pid >> pid.txt
Note
To save the stack information or send the stack information to R&D engineers for analysis, we recommend that you redirect the stack information to a file.
jstack can capture the thread stack information in tools and in JVM. When you run OBLOADER or OBDUMPER on a server with high specifications, many threads are generated in the import or export process, which consume many resources. Actually, some threads are also generated in JVM. The following table describes the threads.
Thread |
Description |
|---|---|
| GC task thread | By default, JVM uses the following formula to calculate the default value of ParallelGCThreads based on the number of logical CPU cores (n CPUs).
-XX:ParallelGCThreads=N specifies the number of parallel GC threads. |
| C1 CompilerThread | By default, two threads are required when compilation is performed in the server and one thread is required when compilation is performed in the client. However, if hierarchical compilation is used, the number of required threads is equal to the number of CPU cores. Run the java -XX:+PrintFlagsInitial \| grep 'CICompiler' and java -XX:+PrintFlagsFinal \| grep 'CICompiler' commands on the CLI to view the initial and final values of parameters when hierarchical compilation is used. If you specify -XX:CICompilerCount=N to set the number of compilation threads, JVM automatically allocates threads based on the ratio of C1:C2=1:2. |
| C2 CompilerThread | This thread is similar to C1 CompilerThread. For more information, see the description of C1 CompilerThread. |
Note
- Besides the
ParallelGCThreadsparameter, the-XX:ConcGCThreadsand-XX:CICompilerCountparameters are also important.- The
ConcGCThreadsparameter specifies the number of concurrent marking threads. To reduce the GC interruption time, both the CMS and G1 collection algorithms require concurrent marking. - The default value of the
ConcGCThreadsparameter is subject to the GC algorithm.- For the G1 collection algorithm, the value of
ConcGCThreadsis calculated by using the following formula: Value ofParallelGCThreads, rounded off to the nearest integer. - For the CMS collection algorithm, the value of
ConcGCThreadsis calculated by using the following formula: (Value ofParallelGCThreads+ 3)/4, rounded down.
- For the G1 collection algorithm, the value of
- The
- JVM calculates the value of
CICompilerCountbased on the number of CPU cores. However, if you set the-XX:CICompilerCount=[n]parameter when-XX:+CICompilerCountPerCPUis enabled, the setting does not take effect. By default,-XX:+CICompilerCountPerCPUis disabled in JDK 7 and enabled in JDK 8.
For JDK of a version earlier than 1.8.0_131, the default values ofConcGCThreadsandCICompilerCountare incorrectly calculated because JVM cannot detect the resource limits of Docker. In this case, we recommend that you upgrade JDK to 1.8.0_131 or later. If you want to use JDK of an earlier version in special cases, you must specify the JVM parameter-XX:-CICompilerCountPerCPU -XX:CICompilerCount=[n]. - The preceding threads are extracted from the stack information captured by the hotspot JVM installed on Intel(R) Xeon(R) Platinum (32c) CentOS. The thread stack information generated varies with the enabled parameters or the platform on which JVM is installed.
View running logs
By default, the running logs of OBLOADER & OBDUMPER are stored in files based on three levels: INFO, WARN, and ERROR. The default log path is in the directory specified in the -f option. You can also specify the --log-path option to set a log output path.
The log files of different levels are respectively named ob-loader-dumper.info, ob-loader-dumper.warn, and ob-loader-dumper.error.
INFO logs: record normal running information.
WARN logs: record warning information. Warnings do not affect the functionality or correctness of applications, but may affect the performance.
ERROR logs: record information about errors such as application running errors or correctness errors.
OBLOADER may generate the ob-loader-dumper.discard and ob-loader-dumper.bad log files, which respectively record duplicate data and bad data. To adjust logs generated, see the "Configure running logs" section in this topic. The following sections describe the key information in the import and export log files.
Performance monitoring
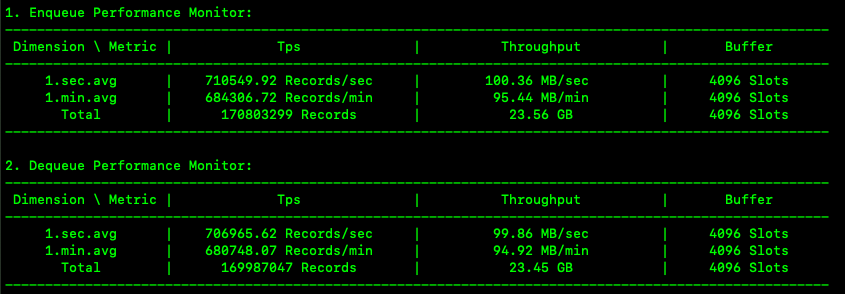
The preceding figure shows the logs that are generated in the ob-loader-dumper.info log file in real time during data import.
In the figure, Enqueue Performance Monitor indicates enqueue monitoring information and Dequeue Performance Monitor indicates dequeue monitoring information.
OBLOADER is designed based on the "producer-consumer" model.
The producer thread reads and parses files, and delivers the data to the memory queue. File parsing consumes a lot of CPU resources. The enqueue performance metrics can reflect the file parsing performance.
The consumer thread inserts data into the database. A lot of I/O resources are consumed to write data. The dequeue performance metrics can reflect the processing capability of the entire link, including the network and database.
The Tps metric indicates the number of rows parsed per second, Throughput indicates the number of bytes parsed per second, and Buffer indicates the actual capacity of the queue. The per-second and per-minute average values and the sum are calculated for these metrics. A small buffer size indicates an idle queue and slow file parsing. In this case, you can increase the degree of parallelism (DOP) for file parsing. An approximately full buffer indicates that data is accumulated in the memory. In this case, you can improve the write performance of the database. For more information, see topics related to Performance tuning.
Progress monitoring

The preceding figure shows the overall import progress. The number of tasks created by OBLOADER equals the number of subfiles generated after the file to be imported is split. The import progress in the memory is updated each time a subfile is imported. You can split a file to be imported into smaller subfiles to display more fine-grained progress information. By default, the size of a subfile is 64 MB. You do not need to change it.
Kernel monitoring
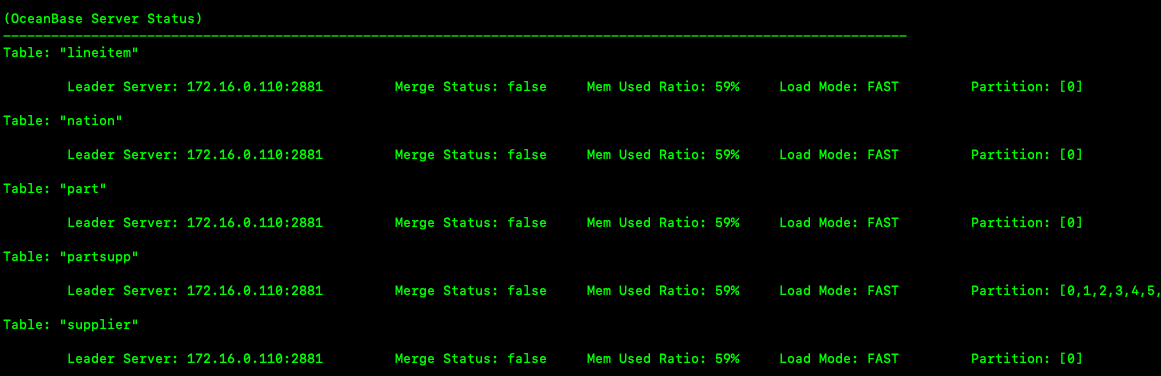
The preceding figure shows the distribution of tables and partitions and the memory usage of the database during data import. OceanBase Database is a distributed database in which tables and partitions may be distributed on different nodes. The major compaction status and memory usage of each node are recorded in logs. Merge Status: true indicates that a major compaction is being performed for the database. OBLOADER suspends the import and will resume the import after the major compaction is completed. Mem Used Ratio indicates the memory usage of the tenant. A memory usage of more than 75% will trigger throttling. Load Mode: SLOW indicates slow import. When the memory usage exceeds 85%, OBLOADER stops import. Load Mode: PAUSE indicates that OBLOADER has suspended the import. OBLOADER will resume the import after the minor compaction is completed and the memory space is released. Load Mode: FAST indicates fast import. Performance monitoring metrics are collected and calculated in real time. The values of monitoring metrics may decrease when OBLOADER stops import, and increase when OBLOADER resumes import. This gives an impression of unstable import performance to users.
Final statistics
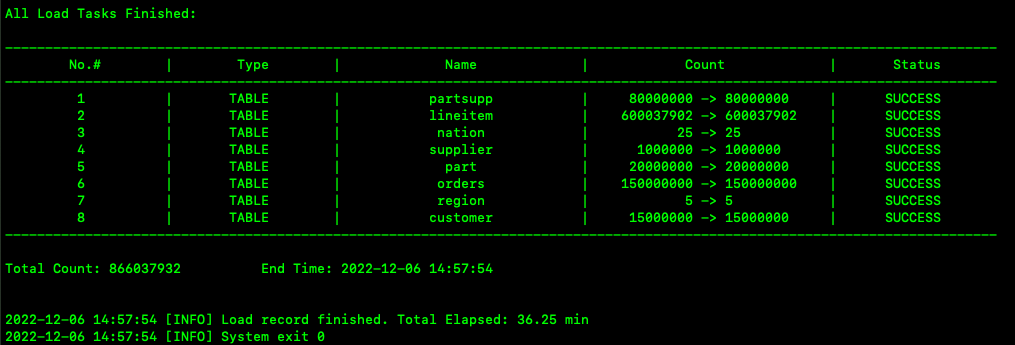
The preceding figure shows the statistics of the entire import process. The table names, number of parsed records, number of imported records, and import status are recorded. Total Count indicates the total number of imported records and End Time indicates the time when the import ends. Total Elapsed indicates the total time consumed in the import. The process exit status code is displayed. 0 indicates a normal exit, and a nonzero value indicates an abnormal exit.
Note
The preceding sections only provide a brief introduction to the data import logs. You can refer to these sections for running logs of data object and data import and export.
Configure running logs
OBLOADER uses the log4j2 log framework. The log configuration file is log4j2.xml in the {ob-loader-dumper}/conf directory. The following example shows how to modify the configurations in the configuration file.
Disable log output in the console
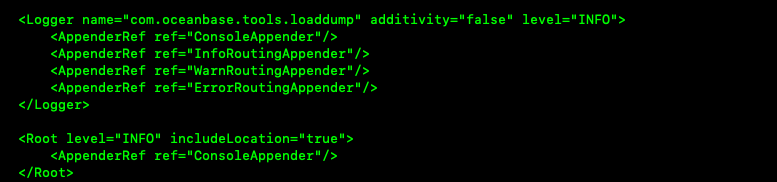
You can disable log output in the console so that all logs are generated in files. To do this, perform the following steps to edit the log4j2.xml configuration file:
Comment out
<AppenderRef ref="ConsoleAppender"/>under theLoggernode.Change
<AppenderRef ref="ConsoleAppender"/>to<AppenderRef ref="InfoRoutingAppender"/>under theRootnode.