


After the ASH report is generated, analyze the report to determine the possible causes of the transient performance issues.
ASH report content
The ASH Report section of the ASH report records statistical information about the ASH report, including the system version, operating system environment, information sampling period, analysis period, ASH and WR data sources, sampling count, event count, and average active session count. It generates information about 18 modules, including Top Active Tenants, Top Node Load, Top Groups, Top Foreground DB Time, Top Background DB Time, Top Sessions, Top IO Bandwidth, Top Blocking Sessions, Top Latchs, Top DB Objects, Activity Over Time, Top Execution Phase, Top IO Events, Top SQL Statement Types, Top SQL with Top Events, Top SQL with Top Operator, Top PL/SQL Procedures, and Complete List of SQL Text And Status.
These modules mainly display the performance data collected by ObServer from two aspects: resource overhead and execution path overhead. Therefore, when analyzing specific performance issues, you can check the relevant modules to determine whether the root cause is a resource bottleneck or inefficient execution methods.
ASH Report
This section displays some information about the sampling time, analysis time, and general statistics in the ASH (Active Session History) report.
- Cluster Name: the name of the database cluster.
- Observer Version: the version information of OceanBase Database, including the version number and detailed build version.
- Operation System Info: the operating system information, including the kernel version and architecture.
- User Input Begin Time: the start time of sampling, indicating the time when session activities start to be recorded.
- User Input End Time: the end time of sampling, indicating the time when session activities stop being recorded.
- Analysis Begin Time: the start time of analysis, indicating the time when the sampling data starts to be analyzed.
- Analysis End Time: the end time of analysis, indicating the time when the sampling data stops being analyzed.
- Ash Data Source: the ASH data source. This column does not exist if ASH is not used.
- Wr Data Source: the WR data source. This column does not exist if WR is not used.
- Elapsed Time: the total number of seconds of all sampling times.
- Ash Num of Sample: the number of ASH samples, indicating the number of recorded session activities.
- Wr Num of Sample: the number of WR samples, indicating the number of performance snapshots generated during the analysis period.
- Average Active Sessions: the average number of active sessions, indicating the average number of active sessions during sampling.
These data help you understand the activity, the number of sessions and events, and the system's activity level during sampling.
ASH Report

           Cluster Name: test425
       Observer Version: OceanBase 4.2.5.3 (203000012025022717-866087xxxxxxxxxxxxxxxxxxxxxxxxxxxxxxx)
  Operation System Info: Linux(3.10.0-327.ali2019.alios7.x86_64)_x86_64
  User Input Begin Time: 2024-09-22 10:26:47
    User Input End Time: 2025-06-22 20:27:07
Ash Analysis Begin Time: 2025-03-05 12:59:50
  Ash Analysis End Time: 2025-03-05 15:47:12
 Wr Analysis Begin Time: 2025-02-28 09:43:43
   Wr Analysis End Time: 2025-03-05 12:59:35
        Ash Data Source: oceanbase.GV$ACTIVE_SESSION_HISTORY
         Wr Data Source: oceanbase.DBA_WR_ACTIVE_SESSION_HISTORY
           Elapsed Time: 453793
      Ash Num of Sample: 11019
       Wr Num of Sample: 475940
Average Active Sessions: 1.07
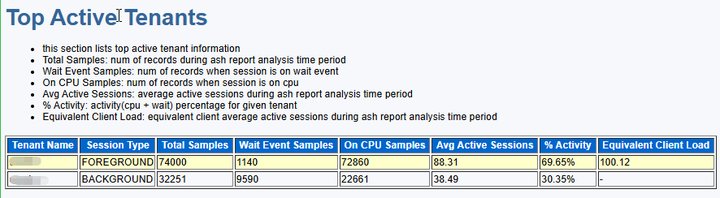
Top Active Tenants
This section divides the resource overhead into foreground user requests and background tasks, allowing you to view the overall resource overhead of the tenant.
- Tenant Name: the name of the tenant, which identifies specific tenant information.
- Session Type: the session type, which can be BACKGROUND or FOREGROUND, indicating background processes and foreground processes, respectively.
- Total Samples: the total number of records, indicating the total number of samples in the ASH report analysis period.
- Wait Event Count: the number of waiting events, indicating the number of samples where sessions were waiting for events.
- On CPU Samples: the number of samples on the CPU, indicating the number of samples where sessions were executed on the CPU.
- Avg Active Sessions: the average number of active sessions, indicating the average number of active database sessions during the sampling period (regardless of whether they were on the CPU or waiting for events).
- % Activity: the activity percentage of events, indicating the percentage of activity (CPU + waiting) for the specified tenant during the specified period.
- Equivalent Client Load: the number of active connections between the client and the database during the ASH report analysis period.
This information provides details about tenant activities, revealing different aspects of database performance and tenant resource usage.
In the Top Active Tenants module, performance issues may originate from within the database or from the interaction chain between the database and business applications. First, confirm the performance issue based on the Equivalent Client Load and Avg Active Sessions metrics. These metrics are used to evaluate the impact of the database and the interaction chain on performance. A higher ratio (Avg Active Sessions/Equivalent Client Load) indicates a greater impact of internal database overhead on performance; a lower ratio indicates a greater impact of the network link or client on performance.
For example, the report shows that the ratio is 88%, indicating that the performance issue is primarily caused by database load. After identifying the database load issue, further analyze the internal resource overhead of the database. In the Top Active Tenants module, foreground user requests consume 69.65% of the database resources, while background tasks account for about 30%. Therefore, the performance bottleneck mainly occurs in the execution chain of user requests. Additionally, foreground tasks' waiting events consume a total of 1140 seconds of database time, while CPU execution consumes 72860 seconds. This indicates that the business model does not suffer from significant waiting due to resource limitations such as disk I/O or network bandwidth. The main overhead is concentrated on CPU execution. Since the workload runs normally on this version, you can infer that the cluster has sufficient CPU resources. The performance slowdown may be due to reduced efficiency in a step of the SQL execution chain after the upgrade.
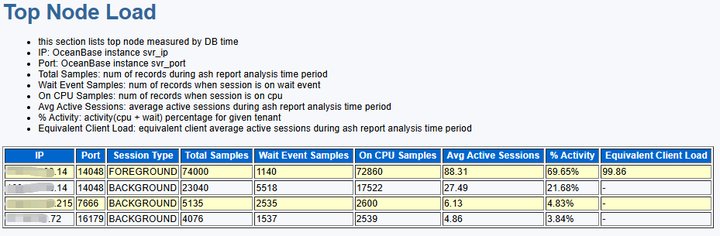
Top Node Load
This section displays the performance metrics of the top nodes for the DB time metric.
IP: The IP address of the server.
Port: The port number of the server.
Session Type: The session type, which can be BACKGROUND or FOREGROUND, indicating background processes and foreground processes, respectively.
Total Samples: The total number of records, representing the total number of samples in the ASH report analysis period.
Wait Event Samples: The number of waiting events, indicating the number of samples for the session waiting on events.
On CPU Samples: The number of samples on the CPU, indicating the number of samples for the session executing on the CPU.
Avg Active Sessions: The average number of active sessions, indicating the average number of database sessions that were active (either on the CPU or waiting for events) during the sampling period.
% Activity: The activity percentage of the event, indicating the percentage of activity (CPU + waiting) for the specified tenant during the specified period.
Equivalent Client Load: The number of active connections between the client and the database. A higher ratio (Avg Active Sessions/Equivalent Client Load) indicates a greater impact of internal database overhead on performance; a lower ratio indicates a greater impact of network links or clients on performance.
This information provides the load-related performance metrics for each node in the database cluster.
This section displays the performance metrics of the top nodes for the DB time metric.
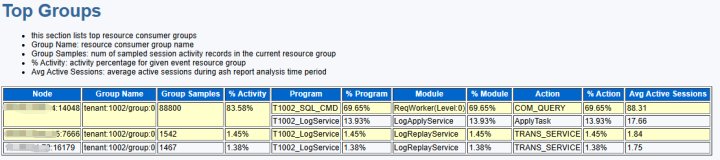
Top Groups
This section displays the resource consumer groups (Resource Consumer Groups) with the highest resource consumption.
Node: The node address.
Group Name: The name of the resource group.
Group Samples: The number of session activity records sampled in the current resource group.
% Activity: The activity percentage of the event, indicating the percentage of activity (CPU + waiting) for the specified tenant during the specified period.
Program: The name of the process corresponding to the background session.
% Program: The proportion of the background session process in the resource group (such as CPU or thread).
Module: The name of the functional module in the program.
% Module: The proportion of the module in the active sessions of the program, used to identify hotspots within the program.
Action: The specific operation in the module.
% Action: The proportion of the operation in the active sessions of the module, further refining the granularity of performance analysis.
Avg Active Sessions: The average number of active sessions, indicating the average number of database sessions that were active (either on the CPU or waiting for events) during the sampling period.
Slot Begin Time: The start time of the session activity period, in the format
YYYY-MM-DD HH:MM:SS(+ offset seconds), indicating the start of the statistical period.Slot Count: The total number of samples in the current period. ASH samples the active session status once per second by default, so the Slot Count value equals the length of the period in seconds.
Action Key: The type of operation that triggered the active session, used to identify the resource consumption of specific services or components. It typically contains the following information:
- Source node: such as
xx.xx.xx.xx:2882(IP and port). - Tenant and resource group: such as
tenant:1002/group:0. - Service type: such as
T1002_LogService-LogRestoreService-RemoteLogWriter(log restore service).
- Source node: such as
Action Samples: The number of active sessions sampled for the operation (Action Key) in the current period. A higher value indicates that the operation consumes more database resources.
This information provides the top resource-consuming groups and their key performance metrics, including the main performance events they encounter, the frequency of these events, the activity percentage, and the average number of concurrent sessions.
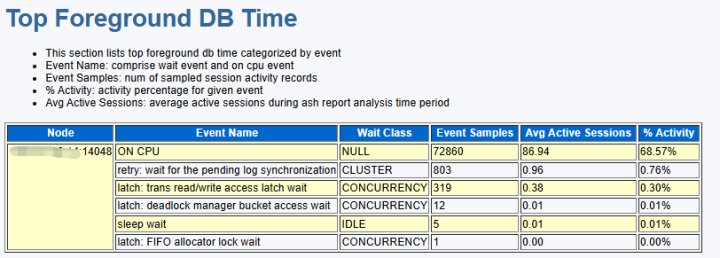
Top Foreground DB Time
This section lists the top consumers of database foreground activity time by event type.
Node: the node address.
Event Name: the event that consumes the most DB time, including both wait events and events on the CPU.
Wait Class: the type of wait event.
Event Samples: the number of session activity records sampled for each event.
Avg Active Sessions: the average number of active sessions, indicating how many database sessions were active on average during the sampling period (regardless of whether they were on the CPU or waiting).
% Activity: the activity percentage of the event, indicating the percentage of activity (CPU + wait) for a given tenant during the specified period.
This information provides the top foreground sessions consuming DB time within the specified analysis period.
For example, in the Top Foreground DB Time data, it can be seen that during business task execution, there are indeed lock conflicts caused by accessing transaction contexts, but the overhead is less than 1% of the total and no wait event corresponding to transaction commit (tx committing wait) is found. Therefore, the two assumptions about performance issues in Top Active Tenants can be ruled out.
In conclusion, the performance degradation is not caused by resource bottlenecks, and it is likely due to performance regression in the new version's execution chain.
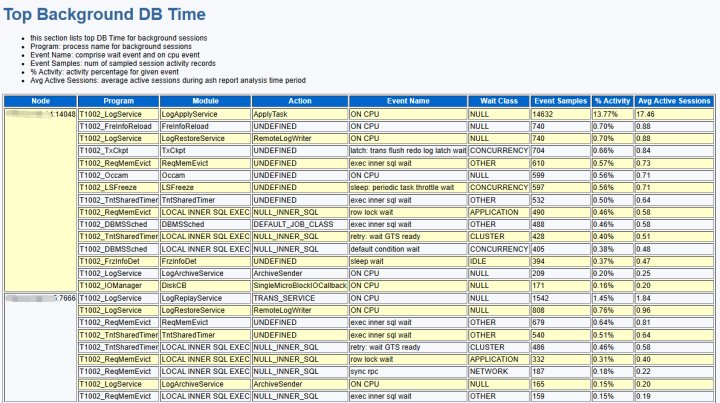
Top Background DB Time
This section displays the DB time consumed by background sessions.
Node: the node address.
Program: the process name corresponding to the background session.
Module: the name of the functional module in the program.
Action: the specific operation within the module.
Event Name: the event that consumes the most DB time, including both wait events and events on the CPU.
Wait Class: the type of wait event.
Event Samples: the number of session activity records sampled for each event.
% Activity: the activity percentage of the event, indicating the percentage of activity (CPU + wait) for a given tenant during the specified period.
Avg Active Sessions: the average number of active sessions, indicating how many database sessions were active on average during the sampling period (regardless of whether they were on the CPU or waiting).
This information provides details on the most resource-intensive background processes, the main types of events they experience, their activity frequency, their contribution to overall DB time, and the average level of concurrent active sessions.
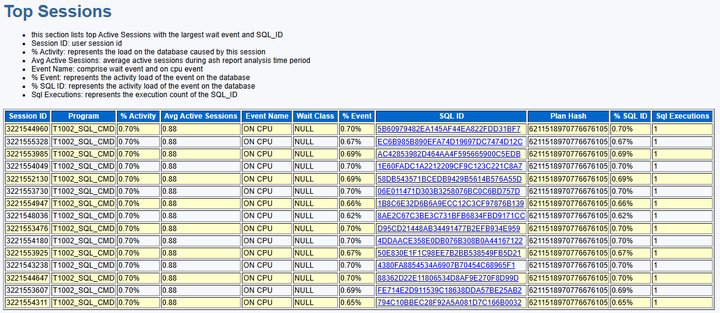
Top Sessions
This section displays information about the top sessions (Top Sessions).
Session ID: the ID of the sampled session.
Program: the process name corresponding to the background session.
% Activity: the activity percentage of the event, indicating the percentage of activity (CPU + wait) for a given tenant during the specified period.
Avg Active Sessions: the average number of active sessions, indicating how many database sessions were active on average during the sampling period (regardless of whether they were on the CPU or waiting).
Event Name: the event that consumes the most DB time, including both wait events and events on the CPU.
Wait Class: the type of wait event.
% Event: the percentage of the event in the total database activity. A high percentage may indicate that the event is a major bottleneck for system performance.
SQL ID: the unique identifier of the SQL query.
Plan Hash: the numerical value of the current SQL execution plan. The same plan will have the same hash value.
% SQL ID: the percentage of the SQL statement associated with the event in the total database activity. A high percentage indicates that the SQL statement is a major source of resource consumption.
Sql Executions: the number of times the SQL statement was executed during the analysis period. Frequent execution may lead to resource contention or lock conflicts.
This information provides a statistical overview of active sessions sorted by session. By analyzing the sampled session ID, activity session percentage, events, number of events, event percentage, and comparing with the current user and sampled activity status, potential issues can be identified.
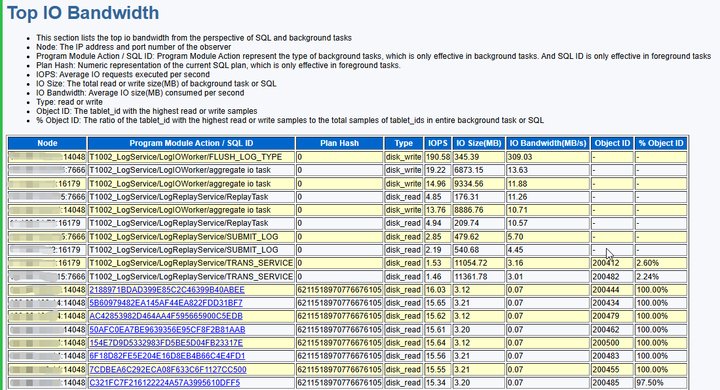
Top IO Bandwidth
This section displays the top I/O throughput from the perspectives of SQL and background tasks.
Node: the node address.
Program Module Action/SQL ID: the type of background task (such as log aggregation and transaction log writing) or the unique identifier of an SQL query, which tracks the resource consumption of specific SQL statements.
Plan Hash: the value of the current SQL execution plan. The same plan has the same hash value.
Type: the type of I/O operation, which differentiates between read and write loads.
IOPS: the number of I/O requests per second, reflecting the load pressure on the storage device. A high IOPS value may indicate frequent small data operations.
IO Size(MB): the total amount of data read and written by the task or SQL during the sampling period (in MB). Background tasks typically involve larger data volumes, such as log batch writes.
IO Bandwidth(MB/s): the I/O throughput per second, which measures the actual utilization of the storage bandwidth. Low bandwidth may be due to data dispersion or hardware limitations.
Object ID: the primary data shard involved in the I/O operation. If no data is present, it indicates no data dispersion or that data was not captured during the sampling period.
% Object ID: the I/O percentage of the dominant shard.
This information provides details on parameters such as Node, SQL ID, and IOPS, allowing analysis of the I/O throughput of SQL and background tasks. By combining read/write types, data volume, and distribution characteristics, it helps identify performance bottlenecks.
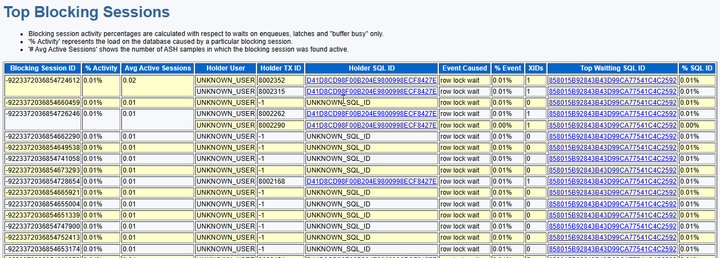
Top Blocking Sessions
This section displays blocking session issues caused by locks (enqueues), latches, and buffer busy contention in the database.
Blocking Session ID: the session identifier that blocks other sessions, used to locate the root cause.
% Activity: the activity percentage of events caused by the blocking session. A high percentage indicates that the session is a major contention source.
Avg Active Sessions: the average number of active sessions for the blocking session during the sampling period, indicating how many database sessions were active on average (either on the CPU or waiting for events) during the sampling period.
Holder User: the user holding the lock or resource.
Holder TX ID: the transaction ID of the resource holder.
Holder SQL ID: the SQL statement identifier holding the resource, used to associate with specific operations.
Event Caused: the type of waiting event caused by the blocking session.
% Event: the percentage of the event in the same category of blocking sessions, helping identify high-frequency contention types.
XIDs: the transaction ID chain associated with the event, used to trace dependencies between transactions.
Top Waiting SQL ID: the SQL statement identifier most affected by the blocking session.
% SQL ID: the percentage of the SQL statement in total blocking waits, used to prioritize optimization of high-impact queries.
This information provides fields such as Blocking Session ID and Holder TX ID for precise identification of the blocking source. By combining % Activity and % Event for quantitative analysis of contention impact, it uses Holder SQL ID and Top Waiting SQL ID to associate SQL-level root causes and leverages XIDs for transaction chain tracing. This enables comprehensive diagnostics from sessions, transactions, to SQL statements, addressing database performance bottlenecks.
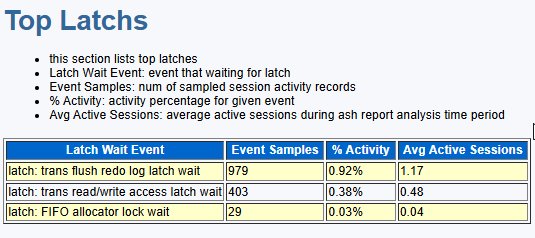
Top Latchs
This section displays the latches with the most contention in the database.
Latch Wait Event: the name of the latch wait event.
Event Samples: the number of session activity records sampled for each event.
% Activity: the activity percentage of the event, indicating the percentage of activity (CPU + waiting) for the specified tenant during the specified period.
Avg Active Sessions: the average number of active sessions, indicating how many database sessions were active on average (either on the CPU or waiting for events) during the sampling period.
This information provides details on the latches causing the highest wait, their wait event counts, activity percentages, and average active sessions, directly pointing to the key concurrency control bottlenecks in the database. This information is crucial for diagnosing and resolving latch contention issues, reducing wait times, improving system response speed, and enhancing overall performance.
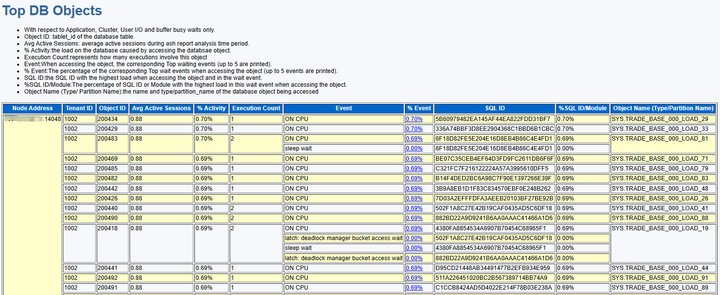
Top DB Objects
This section quantifies the access load and associated SQL statements for database objects such as tables and partitions by analyzing four types of key wait events: Application, Cluster, User I/O, and buffer busy. This helps identify high-contention hotspots.
Node Address: The node address in the format IP:Port, used to identify the physical node location in a distributed environment.
Tenant ID: The unique identifier for a tenant.
Object ID: The tablet_id of the database table, used for metadata association.
Avg Active Sessions: The average number of active sessions, indicating how many database sessions were active on average during the sampling period, regardless of whether they were on the CPU or waiting for events.
% Activity: The activity percentage of the event, representing the percentage of activity (CPU + wait) for the specified tenant during the specified period.
Execution Count: The total number of SQL executions for the object. Frequent access can lead to resource contention.
Event: The corresponding top wait event (up to 5 events are printed).
% Event: The percentage of the corresponding top wait event (up to 5 events are printed).
SQL ID: The SQL ID with high load in the wait event.
% SQL ID/Module: The percentage of the SQL ID or module with high load in the wait event, used for prioritizing optimization of high-impact queries.
Object Name (Type/Partition Name): The name, type, and partition information of the database object being accessed.
This information helps identify hotspots causing high resource contention by quantifying the access load, associated SQL statements, and wait events for database objects such as tables and partitions. It provides direct evidence for optimizing table structure, index design, and SQL performance.
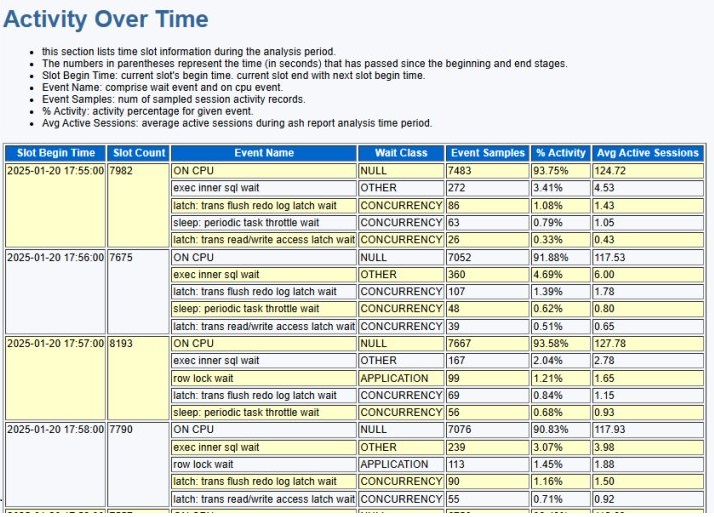
Activity Over Time
This section shows the dynamic changes in database activity during the analysis period based on time intervals.
Slot Begin Time: The start time of the current time slot. Each time slot ends when the next time slot begins.
Slot Count: The total number of samples in the current time period. ASH samples active session states once per second by default, so the Slot Count value equals the length of the time period in seconds.
Event Name: The event that consumes the most DB Time, including both wait events and events occurring on the CPU.
Wait Class: The type of the wait event.
Event Samples: The number of session activity records sampled for each event.
% Activity: The activity percentage of the event, representing the percentage of activity (CPU + wait) for the specified tenant during the specified period.
Avg Active Sessions: The average number of active sessions, indicating how many database sessions were active on average during the sampling period, regardless of whether they were on the CPU or waiting for events.
This information provides a time-series view of the dynamic changes in database activity during the analysis period, including the distribution of key events, activity intensity, and the evolution of resource contention over time. This is valuable for identifying performance trends, managing peak periods, and developing performance optimization strategies based on time dimensions.
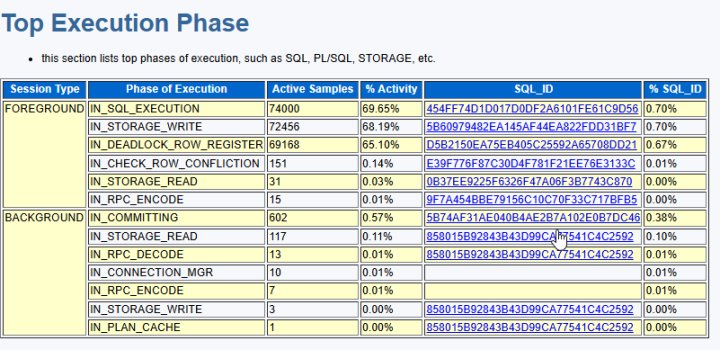
Top Execution Phase
This section displays the activities that account for a significant portion of the execution phase, categorized by session type. It covers various aspects such as SQL execution, PL/SQL processing, and storage read/write operations.
Session Type: The type of session, which can be BACKGROUND or FOREGROUND, representing background processes and foreground processes, respectively.
Phase of Execution: The name of the execution phase, such as IN_SQL_EXECUTION (SQL execution), IN_COMMITTING (commit process), IN_PLSQL_EXECUTION (PL/SQL execution), and so on.
Active Samples: The number of occurrences or records for each execution phase.
% Activity: The percentage of activity for the event, indicating the percentage of activity (CPU + wait) for the specified tenant during the specified period.
SQL ID: The SQL ID with the highest load in the wait event.
% SQL ID/Module: The percentage of the SQL ID or module with the highest load in the wait event, used to prioritize the optimization of high-impact queries.
Since performance issues in the base path typically affect all requests in the database, the Top Execution Phase section provides an intuitive summary of the impact on the base path.
For example, the content of the Top Execution Phase module provides the following information:
IN_SQL_EXECUTION accounts for 69.65% of the overhead, representing the total overhead of SQL execution after the plan is obtained. In OceanBase Database, the IN_SQL_EXECUTION phase includes sub-phases such as IN_STORAGE_WRITE, IN_STORAGE_READ, and IN_RPC_ENCODE. From this metric, we can see that the main overhead of SQL is in the execution (EXECUTION) phase, not in the parsing (PARSER) or plan cache (PLAN CACHE) phase.
IN_STORAGE_WRITE is a sub-phase of IN_SQL_EXECUTION, accounting for 68.19% of the overhead. This indicates that the main performance overhead occurs during data writing to the memtable.
IN_DEADLOCK_ROW_REGISTER is a sub-phase of IN_STORAGE_WRITE, accounting for 65.10% of the overhead. This indicates that most of the overhead occurs in this phase.
In benchmark testing for import-type tasks, these three metrics typically do not exceed 30%. This is because, in import-type tasks, the memtable dump, clog synchronization, and disk write background tasks consume a portion of the CPU resources, and the SQL parsing and expression calculation phases also consume a portion of the CPU resources. In this task, the overhead of the IN_STORAGE_WRITE phase is close to 70%, significantly higher than the benchmark reference value, indicating that the performance issues in this business scenario mainly occur in this phase. Additionally, the IN_DEADLOCK_ROW_REGISTER phase is responsible for registering the row lock information held in the written data to the Deadlock Manager, facilitating the detection of active transactions for deadlocks by background tasks. This operation typically involves updating and maintaining a hashmap value, which is a very fast operation. In benchmark testing, the overhead of this phase is usually no more than 3%. Clearly, in this system, the overhead is much greater than the benchmark empirical value.
Based on the above analysis, we can conclude that the performance issues are primarily in the IN_DEADLOCK_ROW_REGISTER phase. This is a common path for memtable writes. Performance issues on the common path can affect either a specific SQL statement or all SQL statements that access this path. So, how can we determine the scope of affected SQL statements in this case?
In addition to listing the overhead of each predefined phase in OceanBase Database, the Top Execution Phase section also displays the SQL statements with the highest overhead in each phase and their specific percentages. From the report data, we can see that the SQL statement with the highest overhead in the IN_DEADLOCK_ROW_REGISTER phase is D5B2150EA75EB405C25592A65708DD21. According to the text information provided in the report, this SQL statement is an INSERT statement:
INSERT INTO TRADE_BASE_000_LOAD_42
SELECT TRADE_NO, TRADE_NO
FROM TRADE_BASE_000_LOAD PARTITION(p42)
WHERE ROWNUM <= 50000000;
The overhead of this SQL statement in the IN_DEADLOCK_ROW_REGISTER phase is 0.67%, which is significantly different from the total overhead of the phase. This indicates that the total overhead of the IN_DEADLOCK_ROW_REGISTER phase is not concentrated on a single SQL statement but is distributed across many SQL statements.
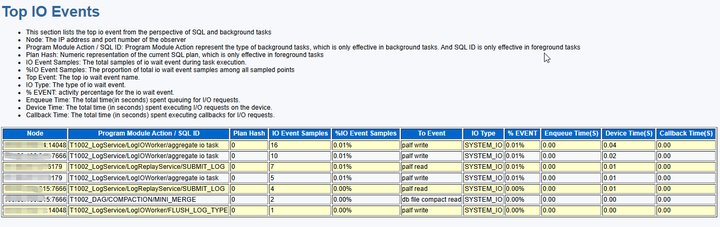
Top IO Events
This section provides statistics on I/O wait events for SQL and background tasks, helping to identify the sources of disk I/O bottlenecks, including high-load SQL queries, background task types, and specific device performance metrics.
Node: The node address.
Program Module Action/SQL ID: The type of background task (such as log aggregation or transaction log write) or the unique identifier of an SQL query, which tracks the resource consumption of specific SQL statements.
Plan Hash: The numerical value of the current SQL execution plan. The same plan will have the same hash value.
IO Event Samples: The total number of I/O wait event samples during task execution.
%IO Event Samples: The proportion of I/O wait event samples among all samples, reflecting the frequency of I/O requests.
Top Event: The name of the main I/O wait event.
IO Type: The type of I/O wait event (read/write/async), used to distinguish operation modes.
% EVENT: The activity percentage of the I/O wait event.
Enqueue Time(S): The total time spent waiting in the queue for I/O requests, in seconds, reflecting the degree of device congestion.
Device Time(S): The total time spent executing I/O requests on the device, in seconds, measuring disk performance.
Callback Time(S): The total time spent on executing I/O request callbacks, in seconds.
This information quantifies I/O wait events for SQL and background tasks. By combining device queueing time (Enqueue Time) and execution time (Device Time), it helps identify high-load SQL queries (through SQL ID and Plan Hash) and disk performance bottlenecks, providing a basis for optimizing I/O-intensive operations.
Top SQL Statement Types
This section displays the execution statistics of various statement types during the ASH report analysis period, helping to analyze where business performance issues occur.
SQL Statement Type: Lists the most frequently executed SQL statement types, such as SELECT, UPDATE, INSERT, or DELETE.
Total Samples: The total number of executions of the given SQL statement type throughout the ASH report analysis period.
% Activity: The activity percentage of the event, indicating the percentage of activity (CPU + wait) for the specified tenant during the specified period.
Sampled Executions: The number of sampled executions of this type of SQL (multiple executions may be independently counted due to different parameters).
Node: The node address.
% Node: The activity percentage of this type of SQL on the node, used to evaluate node load balancing.
% On CPU: The percentage of time this type of SQL spends running on the CPU. A high value indicates CPU-intensive operations, such as complex aggregations.
% Event: The percentage of this event in the total database activity. A high percentage may indicate that this event is a major bottleneck for system performance.
This information provides a categorized statistical analysis of SQL statement executions, revealing the impact of different operation types (such as queries and updates) on database resource consumption and system activity. These data are valuable for identifying high-load SQL types, optimizing query strategies, balancing resource allocation, and performing targeted performance tuning.

Top SQL with Top Events
This section displays the SQL statements most closely associated with specific top events.
SQL ID: The SQL ID with a high load in the wait event.
Plan Hash: The hash value of the current SQL execution plan. The same plan has the same hash value.
Active Samples: The number of occurrences or records for each execution phase.
% Activity: The activity percentage of the event, indicating the percentage of activity (CPU + wait) for a given tenant during a specified period.
Sampled Executions: The number of sampled executions for this type of SQL (executions with different parameters may be independently counted).
Top Event: The name of the primary I/O wait event.
% Event: The percentage of this event in the total database activity. A high percentage may indicate that this event is a major bottleneck in system performance.
Top Operator/ExecPhase: The operation with the longest duration in the current SQL execution plan.
% Operator/ExecPhase: The percentage of this operation/phase in the total SQL duration, used to identify execution plan bottlenecks.
SQL Text: The text of the SQL query.
This information identifies the specific events causing the highest activity percentage in SQL execution, directly pointing to the core of performance bottlenecks. By identifying these "bottleneck" events and related SQL statements, database administrators can optimize SQL statements, adjust execution plans, or improve system configurations to reduce wait times and improve resource utilization.
The Top SQL with Top Events module shows specific SQL statements that account for more than 1% of overall activity. Because this section is empty, the performance issue is not limited to certain SQL statements; instead, SQL execution has slowed down overall. Based on the report, the performance issue is related to the IN_DEADLOCK_ROW_REGISTER phase and is a general performance problem.
Top SQL with Top Events:
  - This Section lists the SQL statements that accounted for the highest percentages event.
  - Plan Hash: Numeric representation of the current SQL plan
  - Active Samples: num of samples for top current SQL
  - % Activity: activity percentage for given SQL ID
  - Sampled Executions: represents the number of times the current SQL execution has been sampled
  - Top Event: top event name for current SQL plan
  - % Event: activity percentage for current SQL plan
  - Top Operator/ExecPhase: top operator name or execution phase for current event
  - % Operator/ExecPhase: activity percentage for given operator
+----------------------------------------+--------------------+--------------------+--------------+--------------------+----------------------------------------------------------------+--------------+--------------------------------------------------------------------------------------------------------------------------------+------------------------+----------------------------------------------------------------+
|                                  SQL ID|           Plan Hash|      Active Samples|    % Activity|  Sampled Executions|                                                       Top Event|       % Event|                                                                                                          Top Operator/ExecPhase|    % Operator/ExecPhase|                                                        SQL Text|
+----------------------------------------+--------------------+--------------------+--------------+--------------------+----------------------------------------------------------------+--------------+--------------------------------------------------------------------------------------------------------------------------------+------------------------+----------------------------------------------------------------+
+----------------------------------------+--------------------+--------------------+--------------+--------------------+----------------------------------------------------------------+--------------+--------------------------------------------------------------------------------------------------------------------------------+------------------------+----------------------------------------------------------------+
Top SQL with Top Operator
This section displays the SQL statements that use specific operators in their execution plans and account for a high proportion of session activity.
SQL ID: The SQL ID with a high load in the wait event.
Plan Hash: The hash value of the current SQL execution plan, used to uniquely identify the SQL execution plan.
Active Samples: The number of occurrences or records for each execution phase.
% Activity: The activity percentage of the event, indicating the percentage of activity (CPU + wait) for a given tenant during a specified period.
Sampled Executions: The number of sampled executions for this type of SQL (executions with different parameters may be independently counted).
Top Operator: The operation with the longest duration in the current SQL execution plan.
% Operator: The percentage of this phase in the total SQL duration, used to identify execution plan bottlenecks.
Top Event: The name of the primary I/O wait event.
% Event: The percentage of this event in the total database activity. A high percentage may indicate that this event is a major bottleneck in system performance.
SQL Text: The text of the SQL query.
This information provides the SQL operators associated with the highest activity percentage, offering precise guidance for database administrators and developers to optimize SQL execution paths.
Top SQL with Top Operator:
  - This Section lists the SQL statements that accounted for the highest percentages of sampled session activity with sql operator
  - Plan Hash: Numeric representation of the current SQL plan
  - Active Samples: num of samples for top current SQL
  - % Activity: activity percentage for given SQL ID
  - Sampled Executions: represents the number of times the current SQL execution has been sampled
  - Top Operator: top operator name for current SQL plan
  - % Operator: activity percentage for given operator
  - Top Event: top event name for current operator
  - % Event: activity percentage for given event
+----------------------------------------+--------------------+--------------+--------------+--------------------+--------------------------------------------------------------------------------------------------------------------------------+--------------+----------------------------------------------------------------+--------------+----------------------------------------------------------------+
|                                  SQL ID|           Plan Hash|Active Samples|    % Activity|  Sampled Executions|                                                                                                                    Top Operator|    % Operator|                                                       Top Event|       % Event|                                                        SQL Text|
+----------------------------------------+--------------------+--------------+--------------+--------------------+--------------------------------------------------------------------------------------------------------------------------------+--------------+----------------------------------------------------------------+--------------+----------------------------------------------------------------+
+----------------------------------------+--------------------+--------------+--------------+--------------------+--------------------------------------------------------------------------------------------------------------------------------+--------------+----------------------------------------------------------------+--------------+----------------------------------------------------------------+
Top PL/SQL Procedures
This section shows information about the top PL/SQL stored procedures.
PLSQL Entry Subprogram: Displays the top-level PL/SQL entry subprogram of an application. It can be a procedure, function, trigger, or package initialization.
% Activity: the activity percentage of events, indicating the percentage of activity (CPU + waiting) for the specified tenant during the specified period.
PLSQL Current Subprogram: Displays the PL/SQL subprogram currently being executed. This is the PL/SQL subprogram being executed at the sampling point. If the value is
SQL, the value indicates the percentage of time that the execution of SQL takes in a specific PL/SQL entry subprogram. If the value is--, the subprogram is not being executed.% Current: The time that a current subprogram (PL/SQL Current Subprogram) consumes during the execution of an entry subprogram. If the current subprogram is SQL, this metric reflects the proportion of time consumed for SQL execution.
This information provides details about the execution of the Top PL/SQL stored procedures, including information on the top-level entry subprograms and the current executing subprogram and activity percentage.
Top PL/SQL Procedures:
  - "PL/SQL Entry Subprogram" represents the application's top-level entry-point(procedure, function, trigger, package initialization) into PL/SQL.
  - "PL/SQL Current Subprogram" is the pl/sql subprogram being executed at the point of sampling. If the value is "SQL", it represents the percentage of time spent executing SQL for the particular plsql entry subprogram.
  - "PL/SQL Entry Subprogram" represents the application's top-level subprogram name
+------------------------------------------------------------+--------------------+------------------------------------------------------------+--------------------+
|                                      PLSQL Entry Subprogram|          % Activity|                                    PLSQL Current Subprogram|           % Current|
+------------------------------------------------------------+--------------------+------------------------------------------------------------+--------------------+
|               oceanbase.dbms_workload_repository.ASH_REPORT|               0.00%|          oceanbase.dbms_workload_repository.ASH_REPORT_TEXT|               0.00%|
+------------------------------------------------------------+--------------------+------------------------------------------------------------+--------------------+
Complete List of SQL Text (V4.2.5 BP7 and earlier)
This section displays a list of SQL text. Each entry contains the SQL ID and text of the SQL query.
SQL ID: The unique identifier of the SQL query.
SQL Text: the text of the SQL query.
This information provides a list of SQL queries that you can use to identify, analyze, and optimize query performance.

Complete List of SQL Text And Status (V4.2.5 BP7 and later)
This section lists the SQL statements and their execution status, including key performance metrics for analysis. Note that some of the most efficient SQL statements, due to their low resource consumption, may not appear in this list.
- First Load Time: The time when the execution plan is first cached, which is the time when the plan is generated.
- Plan Cache Hit Rate: The percentage of times the query optimizer successfully retrieves execution plans from the cache instead of regenerating them.
- AVG RPC: The average number of RPCs initiated when the SQL statement is executed each time.
- AVG Partition: The average number of partitions accessed during an execution.
- Route Miss Rate: The percentage of requests where partition routing errors occur. This refers to the probability that a request is incorrectly sent to a node that does not contain the target data node.
- AVG Disk Reads: The average number of bytes read from the disk during each process execution.
- Muti Query Rate: the percentage of multi-statement queries (requests that contain multiple SQL statements).
- Muti Query Batch Rate: the percentage of requests executed in batch mode.
- AVG Error: The average number of errors occurring per request.
- Full Table Scan Rate: The percentage of the operations in the execution plan that are full table scans.
- AVG Retry: The average number of retries performed during each execution, which can be caused by various reasons such as timeouts or conflicts.
- Executions: The total number of times the SQL statement is executed in the statistical time period.
- AVG Elapsed Time: The average time spent in executing the statement.

This information provides a comprehensive view of the SQL query execution efficiency, resource consumption, and stability, which can be used to quickly identify performance bottlenecks, optimize the query statement, and adjust the database configuration.
Related wait events
See General wait events for the meaning of each wait event. This helps you quickly locate issues when analyzing the report.