


OceanBase Database Proxy (ODP) provides a range of internal tables and system logs for you to locate performance bottlenecks. You can analyze ODP behaviors by using audit logs, slow logs, and statistical logs.
The following figure shows the major types of possible ODP exceptions:
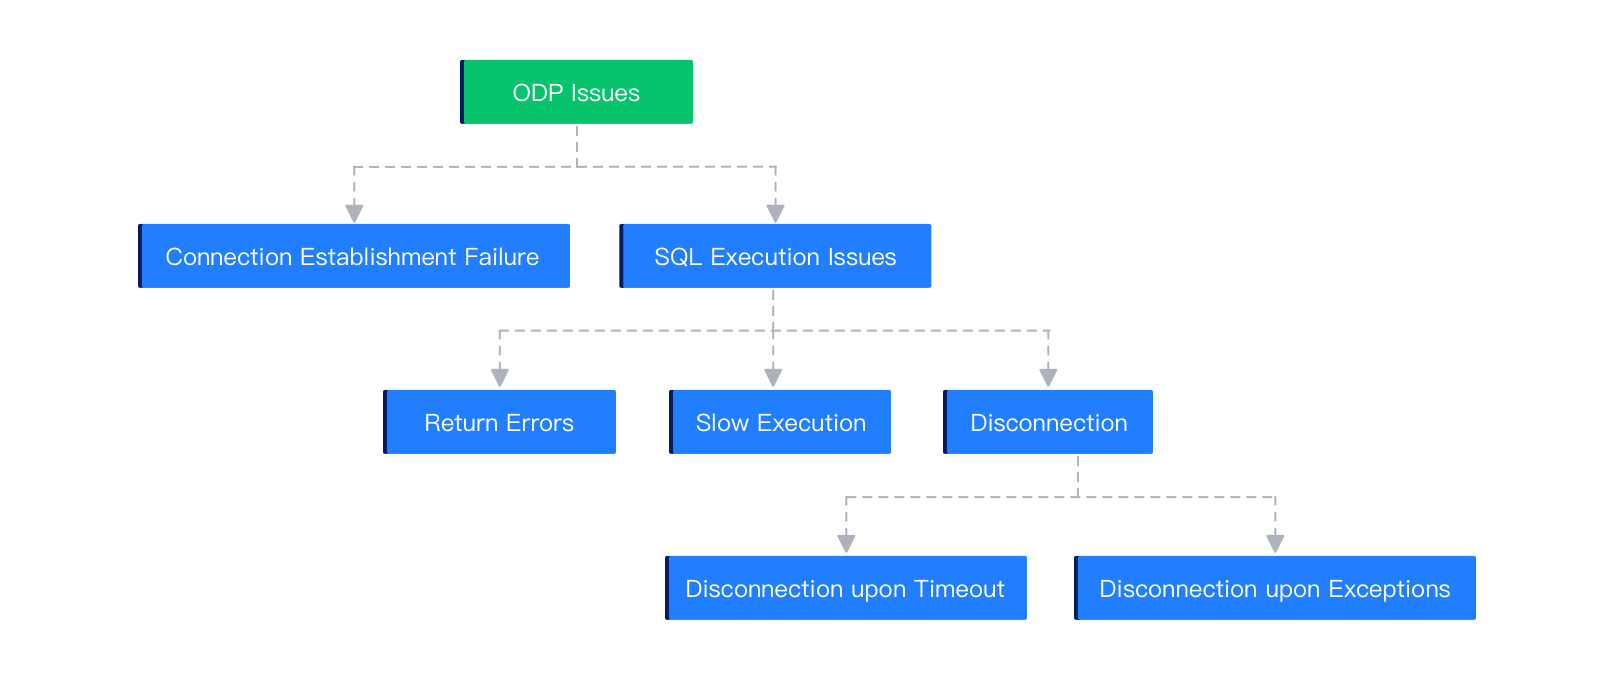
The exceptions are described as follows:
Connection establishment failure
This error indicates that the application system failed to connect to an OBServer node. Possible causes include: overloading of the database system due to a large number of requests, exceptions of the application system, such as a full GC, an NIC error of the application server, and incorrect database configuration at the application layer, and a network exception between the application server and the OBServer node. This type of errors may be reported by an application, ODP, and OBServer node.
SQL execution exceptions
Error code returned: Explicit error codes are returned from the backend database system. You can troubleshoot the faulty OBServer nodes based on the error codes.
Slow execution: You must first locate the component that consumes an unusually long period of time and perform in-depth troubleshooting.
Disconnection: You must first locate the component that disconnects from a link and perform in-depth troubleshooting.
ODP provides various logs for troubleshooting.
Error logs
Error logs are recorded in the
obproxy_error.logfile. It records requests that are incorrectly executed, ODP errors, and errors returned from OBServer nodes.Audit logs
Audit logs are recorded in the
obproxy_digest.logfile. It records the requests whose execution time exceeds the value specified for thequery_digest_time_thresholdparameter (which defaults to 100 ms), and requests with incorrect responses.Note
The
query_digest_time_thresholdparameter specifies the threshold of request execution duration. Its value range is [0s, 30d]. If the execution duration of a request exceeds the threshold, a log is recorded in theobproxy_digest.logfile.Slow request logs
Slow request logs are recorded in the
obproxy_slow.logfile. It records the requests whose execution duration exceeds the value specified for theslow_query_time_thresholdparameter. The default threshold is 500 ms.Note
The
slow_query_time_thresholdparameter specifies the execution duration threshold of slow requests. Its value range is [0s, 30d]. If the execution duration of a request exceeds the threshold, a log is recorded in theobproxy_slow.logfile.Statistical logs
Statistical logs are recorded in the
obproxy_stat.logfile at the interval specified by themonitor_stat_dump_intervalparameter. The default interval is 1 minute. Statistical logs allow you to view the execution of SQL statements in ODP within the last minute.Primary logs
Primary logs are recorded in the
obproxy.logfile and are classified into the following four levels: DEBUG, TRACE, INFO, and ERROR. The log level is specified by thesyslog_levelparameter. You can obtain all logs of a session for further troubleshooting by using thetrace_idfield.
The obproxy.log file records information in detail, including the duration of each sub-step. To search for slow SQL queries, use the keyword Slow Query. Here is an example:
[2022-07-11 14:32:51.758195] WARN  [PROXY.SM] update_cmd_stats (ob_mysql_sm.cpp:8425) [74744][Y0-7F4B1CEA13A0] [lt=7] [dc=0] Slow Query: ((
client_ip={127.0.0.1:50422},   // The IP address of the client that sends the query.
server_ip={xx.xx.xx.xx:33041}, // The IP address of the OBServer node to which the SQL query is routed.
obproxy_client_port={xx.xx.xx.xx:52052},  // The address of ODP that connects to the OBServer node.
server_trace_id=Y81100B7C0535-0005E3460FBBE3CD-0-0, // The trace ID of the execution process in the target OBServer node.
route_type=ROUTE_TYPE_NONPARTITION_UNMERGE_LOCAL, // The routing strategy used for the SQL query.
user_name=root,         // The username.
tenant_name=sys,        // The name of the tenant.
cluster_name=ob9988.zhixin.lm.100.xx.xx.xx,  // The name of the cluster.
logic_database_name=,  // The name of the logical database.
logic_tenant_name=,    // The name of the logical tenant.
ob_proxy_protocol=0,   // The protocol type.
cs_id=14,         // The connection ID used during client login, which is assigned by ODP.
proxy_sessid=7230691598940700681, // The connection ID recorded when the client accesses OceanBase Database.
ss_id=21,
server_sessid=3221588238,  // The connection ID of the SQL query on the target OBServer node. This ID is assigned by the OBServer node.
sm_id=14,
cmd_size_stats={
    client_request_bytes:20,  // The size of the request packet sent by the client to ODP.
    server_request_bytes:38,  // The size of the request packet sent by ODP to the target OBServer node.
    server_response_bytes:0,  // The size of the response packet sent by the target OBServer node to ODP.
    client_response_bytes:71}, // The size of the response packet sent by ODP to the client.
cmd_time_stats={
    client_transaction_idle_time_us=0, // The time interval, in μs, between the start of the current SQL query and the end of the last SQL query in the transaction.
    client_request_read_time_us=97, // The time, in μs, spent by ODP in reading the request packet from the client.
    client_request_analyze_time_us=95, // The time, in μs, spent by ODP in analyzing the SQL query sent by the client.
    cluster_resource_create_time_us=0, // The time, in μs, spent by ODP in creating the cluster cache. ODP needs to create the cluster cache only when it accesses the cluster for the first time.
    pl_lookup_time_us=0, // The time, in μs, spent in retrieving the routing table based on the SQL query.
    pl_process_time_us=0,  // The time, in μs, spent in processing the routing table.
    congestion_control_time_us=21,  // The time, in μs, spent in retrieving the blocklist based on the SQL query.
    congestion_process_time_us=3,  // The time, in μs, spent in checking and filtering based on the blocklist.
    do_observer_open_time_us=55,  // The time, in μs, spent in retrieving the available connections from the target OBServer node, including the connection time (connect_time).
        server_connect_time_us=0,  // The time, in μs, spent in creating the connection between the client and the target OBServer node.
    server_sync_session_variable_time_us=0,  // The time, in μs, spent in initializing the target connection. The initialization process includes saving the login information (saved_login) and synchronizing the database, system variables, the last insert ID (the ID of the last record you added to your database, represented by last_insert_id), and the transaction start time (start_trans).
        server_send_saved_login_time_us=0,  // The time, in μs, spent in saving the login information for the target connection.
        server_send_use_database_time_us=0,  // The time, in μs, spent in synchronizing the database for the target connection.
        server_send_session_variable_time_us=0,  // The time, in μs, spent in synchronizing modified system variables for the target connection.
        server_send_all_session_variable_time_us=0,  // The time, in μs, spent in synchronizing all system variables for the target connection.
        server_send_last_insert_id_time_us=0, // The time, in μs, spent in synchronizing the last insert ID (last_insert_id) for the target connection.
        server_send_start_trans_time_us=0,   // The time, in μs, spent in synchronizing the transaction start time (start_trans/begin) for the target connection.
    build_server_request_time_us=23,  // The time, in μs, spent in creating the request packets to be sent to the target OBServer node.
    plugin_compress_request_time_us=0,   // The time, in μs, spent in compressing the request packet.
    prepare_send_request_to_server_time_us=409,  // The time, in μs, elapsed from the moment ODP received the request from the client to the moment the request is forwarded to an OBServer node for execution. The value of this parameter is the sum of the values of the preceding parameters.
    server_request_write_time_us=32,  // The time, in μs, spent by ODP in sending the request packet to the target OBServer node.
    server_process_request_time_us=3039883,   // The time, in μs, spent by the OBServer node in executing the SQL query.
    server_response_read_time_us=67,   // The time, in μs, spent by ODP in reading the response packet from the target OBServer node.
    plugin_decompress_response_time_us=59, // The time, in μs, spent in decompressing the response packet.
    server_response_analyze_time_us=70,  // The time, in μs, spent in analyzing the response packet.
    ok_packet_trim_time_us=0, // The time, in μs, spent in trimming the last OK packet from the response packet.
    client_response_write_time_us=185,  // The time, in μs, spent by ODP in sending the response packet to the client.
    request_total_time_us=3041116},  // The total time, in μs, spent by ODP in processing the request. The value is the sum of all the previous time.
sql=select sleep(3)   // The SQL query sent by the client.
)
The request_total_time_us parameter indicates the total time spent by ODP on processing the request. The server_process_request_time_us parameter indicates the total duration of request transmission from ODP to the OBServer node and request processing on the OBServer node. Based on these logs, you can learn about the time consumption of each execution step of slow SQL statements, which makes SQL troubleshooting easier.