


OceanBase Connector/J introduces Simple Logging Facade for Java (SLF4J) to implement a wide range of logging features based on the logback logging framework.
OceanBase Connector/J supports not only general logs but also I/O logs and time consumption logs. During routine operations and maintenance, you can analyze the logs to check whether the Java Database Connectivity (JDBC) driver consumes too much time and whether errors occur.
Enable logging
To enable logging, perform the following operations:
Configure the URL parameter. Add the
log=trueconnection attribute to the URL of OceanBase Connector/J. Here is an example:jdbc:oceanbase://xxx.xxx.xxx.xxx:xxxx/db_name?user=your_username&password=your_password&option1=value1[&option2=value2...]Add dependencies to the
pom.xmlfile. Add the SLF4J and logback dependencies to thepom.xmlfile. Here is an example:<dependency> <groupId>org.slf4j</groupId> <artifactId>slf4j-api</artifactId> <version>[1.4.0,1.7.25]</version> </dependency> <dependency> <groupId>ch.qos.logback</groupId> <artifactId>logback-classic</artifactId> <version>1.2.3</version> </dependency>Configure the
logback.xmlfile. Create alogback.xmlfile in theresourcesdirectory of the project. For more information, see Log configurations.After you enable logback, it will search for the configuration file as follows:
- Search for the
logback-test.xmlfile inclasspath. - Search for the
logback.groovyfile inclasspathiflogback-test.xmlis not found. - Search for the
logback.xmlfile inclasspathiflogback.groovyis not found. - If none of the preceding files is found, logback will use the Service Provider Interface (SPI) mechanism of Java Development Kit (JDK) to search for the logback configuration implementation class in
META-INF/services/ch.qos.logback.classic.spi.Configurator. This implementation class must implement the Configuration interface, so that logback can use the class for configuration. - If the preceding operations fail, logback will use its built-in BasicConfigurator for configuration and output logs to the console.
- Search for the
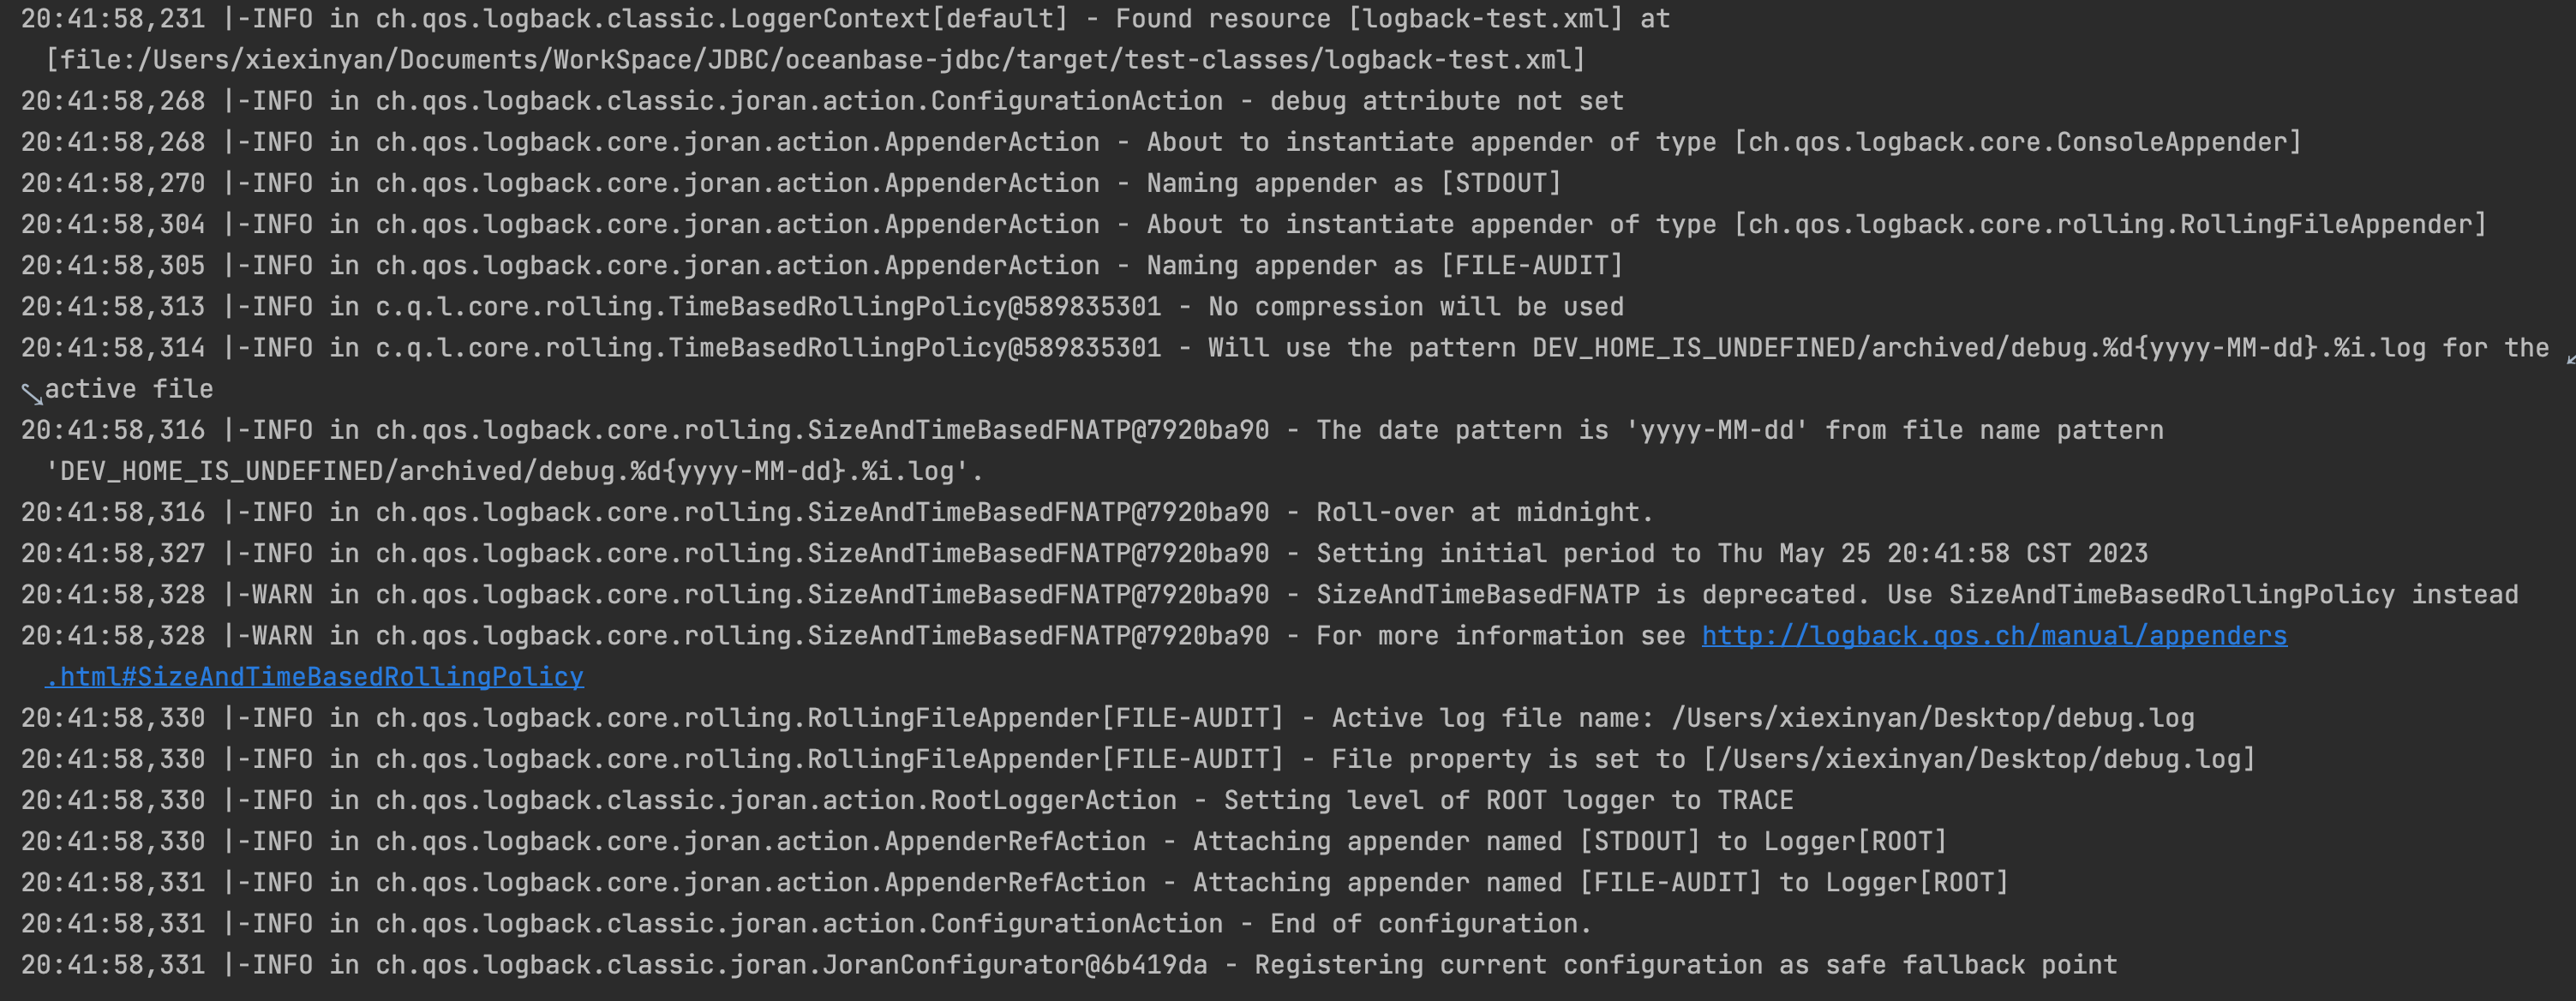
When logging is enabled, the console generates the following output:
Log configurations
General logs, I/O logs, and time consumption logs of OceanBase Connector/J record different information. Therefore, the logback.xml file for these three types of logs are configured in different ways.
General logs
General logs record the key information of different log levels and the debug information (DEBUG level) for locating faults. Log levels are DEBUG, TRACE, INFO, WARN, USER_ERR, and ERROR, which are ranked in ascending order of severity.
The following is a sample logback.xml configuration file for general logs:
<?xml version="1.0" encoding="UTF-8"?>

<configuration>

    <appender name="STDOUT" class="ch.qos.logback.core.ConsoleAppender">
        <filter class="ch.qos.logback.classic.filter.ThresholdFilter">
            <level>warn</level>
        </filter>
        <encoder class="ch.qos.logback.classic.encoder.PatternLayoutEncoder">
            <pattern>%d{yyyy-MM-dd HH:mm:ss.SSS} [%thread] %-5level %logger{36} - %msg%n</pattern>
        </encoder>
    </appender>

    <property name="LOG_HOME" value="/Users/xiexinyan/Desktop"/>
    <appender name="FILE-AUDIT" class="ch.qos.logback.core.rolling.RollingFileAppender">
        <file>${LOG_HOME}/jdbc.log</file>
        <!-- ThresholdFilter: filters out TRACE and DEBUG logs. -->
        <!-- The threshold must be greater than the level of the root node. -->
        <filter class="ch.qos.logback.classic.filter.ThresholdFilter">
            <level>info</level>
        </filter>
        <encoder class="ch.qos.logback.classic.encoder.PatternLayoutEncoder">
            <pattern>%d{yyyy-MM-dd HH:mm:ss.SSS} [%thread] %-5level %logger{36} - %msg%n</pattern>
        </encoder>
        <rollingPolicy class="ch.qos.logback.core.rolling.TimeBasedRollingPolicy">
            <fileNamePattern>${DEV_HOME}/archived/debug.%d{yyyy-MM-dd}.%i.log</fileNamePattern>
            <!--The retention period of logs, in days.-->
            <MaxHistory>30</MaxHistory>
            <timeBasedFileNamingAndTriggeringPolicy class="ch.qos.logback.core.rolling.SizeAndTimeBasedFNATP">
                <maxFileSize>100MB</maxFileSize>
            </timeBasedFileNamingAndTriggeringPolicy>
        </rollingPolicy>
    </appender>

    <!-- The root node is the top ancestor of all loggers. If no level is specified for a user-defined logger, the logger inherits its parent logger's level. If its parent or any other ancestors do not have a level, it inherits the level of the root node.-->
    <root level="info">
        <appender-ref ref="STDOUT"/>
        <appender-ref ref="FILE-AUDIT"/>
    </root>

</configuration>
Here is an example of general logs:
2023-08-11 11:42:31.042 [main] ERROR c.oceanbase.jdbc.OceanBaseStatement - error executing query
java.sql.SQLSyntaxErrorException: (conn=196725) ORA-00942: table or view 'TEST.CLOBTEST1' does not exist
[xx.xxx.xxx.xxx:65000] [2023-08-11 11:42:31.182716] [YFDE80BA2DA8D-0006029ACDC86636-0-0]
    at com.oceanbase.jdbc.internal.util.exceptions.ExceptionFactory.createException(ExceptionFactory.java:110)
    at com.oceanbase.jdbc.internal.util.exceptions.ExceptionFactory.create(ExceptionFactory.java:202)
    at com.oceanbase.jdbc.OceanBaseStatement.executeExceptionEpilogue(OceanBaseStatement.java:317)
    at com.oceanbase.jdbc.OceanBaseStatement.executeInternal(OceanBaseStatement.java:491)
    at com.oceanbase.jdbc.OceanBaseStatement.execute(OceanBaseStatement.java:670)
    at com.oceanbase.jdbc.OceanBaseStatement.execute(OceanBaseStatement.java:637)
    at com.oceanbase.jdbc.BaseOracleTest.createTable(BaseOracleTest.java:430)
    at com.oceanbase.jdbc.BaseOracleTest.createTable(BaseOracleTest.java:399)
    at com.oceanbase.jdbc.ClobOracleTest.aone50824294(ClobOracleTest.java:884)
    at sun.reflect.NativeMethodAccessorImpl.invoke0(Native Method)
    at sun.reflect.NativeMethodAccessorImpl.invoke(NativeMethodAccessorImpl.java:62)
    at sun.reflect.DelegatingMethodAccessorImpl.invoke(DelegatingMethodAccessorImpl.java:43)
    at java.lang.reflect.Method.invoke(Method.java:498)
    at org.junit.runners.model.FrameworkMethod$1.runReflectiveCall(FrameworkMethod.java:59)
    at org.junit.internal.runners.model.ReflectiveCallable.run(ReflectiveCallable.java:12)
    at org.junit.runners.model.FrameworkMethod.invokeExplosively(FrameworkMethod.java:56)
    at org.junit.internal.runners.statements.InvokeMethod.evaluate(InvokeMethod.java:17)
    at org.junit.internal.runners.statements.RunBefores.evaluate(RunBefores.java:26)
    at org.junit.rules.TestWatcher$1.evaluate(TestWatcher.java:61)
    at org.junit.runners.ParentRunner$3.evaluate(ParentRunner.java:306)
    at org.junit.runners.BlockJUnit4ClassRunner$1.evaluate(BlockJUnit4ClassRunner.java:100)
    at org.junit.runners.ParentRunner.runLeaf(ParentRunner.java:366)
    at org.junit.runners.BlockJUnit4ClassRunner.runChild(BlockJUnit4ClassRunner.java:103)
    at org.junit.runners.BlockJUnit4ClassRunner.runChild(BlockJUnit4ClassRunner.java:63)
    at org.junit.runners.ParentRunner$4.run(ParentRunner.java:331)
    at org.junit.runners.ParentRunner$1.schedule(ParentRunner.java:79)
    at org.junit.runners.ParentRunner.runChildren(ParentRunner.java:329)
    at org.junit.runners.ParentRunner.access$100(ParentRunner.java:66)
    at org.junit.runners.ParentRunner$2.evaluate(ParentRunner.java:293)
    at org.junit.internal.runners.statements.RunBefores.evaluate(RunBefores.java:26)
    at org.junit.internal.runners.statements.RunAfters.evaluate(RunAfters.java:27)
    at org.junit.runners.ParentRunner$3.evaluate(ParentRunner.java:306)
    at org.junit.runners.ParentRunner.run(ParentRunner.java:413)
    at org.junit.runner.JUnitCore.run(JUnitCore.java:137)
    at com.intellij.junit4.JUnit4IdeaTestRunner.startRunnerWithArgs(JUnit4IdeaTestRunner.java:69)
    at com.intellij.rt.junit.IdeaTestRunner$Repeater$1.execute(IdeaTestRunner.java:38)
    at com.intellij.rt.execution.junit.TestsRepeater.repeat(TestsRepeater.java:11)
    at com.intellij.rt.junit.IdeaTestRunner$Repeater.startRunnerWithArgs(IdeaTestRunner.java:35)
    at com.intellij.rt.junit.JUnitStarter.prepareStreamsAndStart(JUnitStarter.java:235)
    at com.intellij.rt.junit.JUnitStarter.main(JUnitStarter.java:54)
Caused by: com.oceanbase.jdbc.internal.util.exceptions.OceanBaseSqlException: ORA-00942: table or view 'TEST.CLOBTEST1' does not exist
I/O logs
I/O logs help you diagnose communication issues on links. Logs of the following levels are involved:
DEBUGlogs: record the send and receive actions of the JDBC driver as well as the OB2.0 protocol packet header information.TRACElogs: record the content (hexadecimal content of packets) sent and received by the JDBC driver.
Notice
When a large number of business requests are initiated, a large number of I/O logs occupy large memory space. Therefore, we recommend that you enable I/O logging only when you diagnose communication issues on links.
To enable I/O logging, add the following code to the <configuration>...</configuration> section of the logback.xml file:
<property name="LOG_HOME" value="/Users/xxxxx/Desktop"/>
<appender name="FILE-IO-TRACE" class="ch.qos.logback.core.rolling.RollingFileAppender">
    <file>${LOG_HOME}/jdbc-io.log</file>
    <filter class="ch.qos.logback.classic.filter.ThresholdFilter">
        <!-- Do not change the log level "trace"! -->
        <level>trace</level>
    </filter>
    <encoder class="ch.qos.logback.classic.encoder.PatternLayoutEncoder">
        <pattern>%d{yyyy-MM-dd HH:mm:ss.SSS} [%thread] %-5level %logger{36} - %msg%n</pattern>
    </encoder>
    <rollingPolicy class="ch.qos.logback.core.rolling.TimeBasedRollingPolicy">
        <fileNamePattern>${DEV_HOME}/archived/debug.%d{yyyy-MM-dd}.%i.io.log</fileNamePattern>
        <timeBasedFileNamingAndTriggeringPolicy class="ch.qos.logback.core.rolling.SizeAndTimeBasedFNATP">
            <maxFileSize>100MB</maxFileSize>
        </timeBasedFileNamingAndTriggeringPolicy>
    </rollingPolicy>
</appender>

<!-- Set the log level to TRACE or DEBUG. -->
<logger additivity="false" level="debug" name="com.oceanbase.jdbc.internal.io">
    <appender-ref ref="FILE-IO-TRACE"/>
</logger>
Here is an example of I/O logs:
2023-08-11 11:42:27.506 [main] DEBUG c.o.j.i.i.i.StandardPacketInputStream - read: , packetLength = 74, packetNumber = 0
2023-08-11 11:42:27.529 [main] DEBUG c.o.j.i.i.o.StandardPacketOutputStream - prepare to send: conn=196725, packetLength = 414, packetNumber = 1
2023-08-11 11:42:27.800 [main] DEBUG c.o.j.i.i.i.StandardPacketInputStream - read: conn=196725, packetLength = 169, packetNumber = 2
2023-08-11 11:42:27.811 [main] DEBUG c.o.j.i.i.o.Ob20PacketOutputStream - prepare to send: connectionId = 196725, requestId = 13380722, obSeqNo = 0, payloadLength = 32, headerChecksum = 30977
2023-08-11 11:42:27.854 [main] DEBUG c.o.j.i.i.i.Ob20PacketInputStream - read: connectionId = 196725, requestId = 13380722, obSeqNo = 1, payloadLength = 121, headerChecksum = 50158
2023-08-11 11:42:27.855 [main] DEBUG c.o.j.i.i.i.StandardPacketInputStream - read: conn=196725(S), packetLength = 1, packetNumber = 1
2023-08-11 11:42:27.857 [main] DEBUG c.o.j.i.i.i.StandardPacketInputStream - read: conn=196725(S), packetLength = 32, packetNumber = 2
2023-08-11 11:42:27.862 [main] DEBUG c.o.j.i.i.i.StandardPacketInputStream - read: conn=196725(S), packetLength = 5, packetNumber = 3
2023-08-11 11:42:27.887 [main] DEBUG c.o.j.i.i.i.StandardPacketInputStream - read: conn=196725(S), packetLength = 58, packetNumber = 4
2023-08-11 11:42:27.888 [main] DEBUG c.o.j.i.i.i.StandardPacketInputStream - read: conn=196725(S), packetLength = 5, packetNumber = 5
2023-08-11 11:42:27.889 [main] DEBUG c.o.j.i.i.i.Ob20PacketInputStream - read: tailChecksum = 430865222
2023-08-11 11:42:27.895 [main] DEBUG c.o.j.i.i.o.Ob20PacketOutputStream - prepare to send: connectionId = 196725, requestId = 13380723, obSeqNo = 0, payloadLength = 76, headerChecksum = 21186
2023-08-11 11:42:27.942 [main] DEBUG c.o.j.i.i.i.Ob20PacketInputStream - read: connectionId = 196725, requestId = 13380723, obSeqNo = 1, payloadLength = 17, headerChecksum = 40044
...
2023-08-11 11:42:32.940 [main] DEBUG c.o.j.i.i.i.Ob20PacketInputStream - read: connectionId = 196725, requestId = 13380731, obSeqNo = 1, payloadLength = 17, headerChecksum = 21605
2023-08-11 11:42:32.942 [main] DEBUG c.o.j.i.i.i.StandardPacketInputStream - read: conn=196725(S), packetLength = 13, packetNumber = 1
2023-08-11 11:42:32.942 [main] DEBUG c.o.j.i.i.i.Ob20PacketInputStream - read: tailChecksum = 402685576
2023-08-11 11:42:32.948 [main] DEBUG c.o.j.i.i.o.Ob20PacketOutputStream - prepare to send: connectionId = 196725, requestId = 13380732, obSeqNo = 0, payloadLength = 5, headerChecksum = 55775
2023-08-11 11:42:32.957 [main] DEBUG c.o.j.i.i.o.Ob20PacketOutputStream - prepare to send: connectionId = 229404, requestId = 2876536, obSeqNo = 0, payloadLength = 5, headerChecksum = 2335
Time consumption logs
Time consumption logs record information such as the time consumed in JDBC API calls and request execution (time consumed in sending requests and parsing responses). The log level is INFO.
To enable time consumption logging, add the following code to the <configuration>...</configuration> section of the logback.xml file:
<appender name="FILE-ELAPSED-TIME" class="ch.qos.logback.core.rolling.RollingFileAppender">
    <file>${LOG_HOME}/jdbc-cost.log</file>
    <filter class="ch.qos.logback.classic.filter.ThresholdFilter">
        <!-- Do not change the log level "info"! -->
        <level>info</level>
    </filter>
    <encoder class="ch.qos.logback.classic.encoder.PatternLayoutEncoder">
        <pattern>%d{yyyy-MM-dd HH:mm:ss.SSS} [%thread] %-5level %logger{36} - %msg%n</pattern>
    </encoder>
    <rollingPolicy class="ch.qos.logback.core.rolling.TimeBasedRollingPolicy">
        <fileNamePattern>${DEV_HOME}/archived/debug.%d{yyyy-MM-dd}.%i.cost.log</fileNamePattern>
        <timeBasedFileNamingAndTriggeringPolicy class="ch.qos.logback.core.rolling.SizeAndTimeBasedFNATP">
            <maxFileSize>100MB</maxFileSize>
        </timeBasedFileNamingAndTriggeringPolicy>
    </rollingPolicy>
</appender>

<!-- Do not change the log level "info"! At present, the level of all time consumption logs is INFO. -->
<logger name="JDBC-COST-LOGGER" level="info" additivity="false">
    <appender-ref ref="FILE-ELAPSED-TIME"/>
</logger>
Here is an example of time consumption logs:
2023-08-11 11:42:27.889 [main] INFO  JDBC-COST-LOGGER - ob20: SendRequest costs 1086us, ReceiveResponse costs 76647us.
2023-08-11 11:42:27.894 [main] INFO  JDBC-COST-LOGGER - JDBC4ResultSet.realClose(live for 259499us): CallInterface costs 29us.
2023-08-11 11:42:27.942 [main] INFO  JDBC-COST-LOGGER - ob20: SendRequest costs 162us, ReceiveResponse costs 47043us.
2023-08-11 11:42:28.270 [main] INFO  JDBC-COST-LOGGER - ob20: SendRequest costs 904us, ReceiveResponse costs 326589us.
2023-08-11 11:42:28.317 [main] INFO  JDBC-COST-LOGGER - ob20: SendRequest costs 86us, ReceiveResponse costs 46699us.
2023-08-11 11:42:28.362 [main] INFO  JDBC-COST-LOGGER - ob20: SendRequest costs 78us, ReceiveResponse costs 45160us.
2023-08-11 11:42:28.411 [main] INFO  JDBC-COST-LOGGER - ob20: SendRequest costs 324us, ReceiveResponse costs 41709us.
2023-08-11 11:42:28.411 [main] INFO  JDBC-COST-LOGGER - JDBC4ResultSet.realClose(live for 2764us): CallInterface costs 8us.
2023-08-11 11:42:28.561 [main] INFO  JDBC-COST-LOGGER - ob20: SendRequest costs 109us, ReceiveResponse costs 39809us.
2023-08-11 11:42:28.561 [main] INFO  JDBC-COST-LOGGER - JDBC4ResultSet.realClose(live for 7429us): CallInterface costs 6us.
2023-08-11 11:42:28.747 [main] INFO  JDBC-COST-LOGGER - ob20: SendRequest costs 134us, ReceiveResponse costs 185586us.
2023-08-11 11:42:28.785 [main] INFO  JDBC-COST-LOGGER - ob20: SendRequest costs 393us, ReceiveResponse costs 37535us.
2023-08-11 11:42:28.825 [main] INFO  JDBC-COST-LOGGER - ob20: SendRequest costs 267us, ReceiveResponse costs 38956us.
2023-08-11 11:42:28.870 [main] INFO  JDBC-COST-LOGGER - ob20: SendRequest costs 1070us, ReceiveResponse costs 43100us.
2023-08-11 11:42:28.916 [main] INFO  JDBC-COST-LOGGER - ob20: SendRequest costs 555us, ReceiveResponse costs 45157us.
2023-08-11 11:42:28.917 [main] INFO  JDBC-COST-LOGGER - JDBC4ResultSet.realClose(live for 8467us): CallInterface costs 22us.
2023-08-11 11:42:29.314 [main] INFO  JDBC-COST-LOGGER - ob20: SendRequest costs 452us, ReceiveResponse costs 45398us.
2023-08-11 11:42:29.314 [main] INFO  JDBC-COST-LOGGER - JDBC4ResultSet.realClose(live for 20197us): CallInterface costs 13us.
2023-08-11 11:42:29.357 [main] INFO  JDBC-COST-LOGGER - ob20: SendRequest costs 250us, ReceiveResponse costs 42573us.
2023-08-11 11:42:29.411 [main] INFO  JDBC-COST-LOGGER - ob20: SendRequest costs 2059us, ReceiveResponse costs 50931us.