Background information
With the explosive growth of data volume and the evolving user needs, database management and optimization have become increasingly critical. As database administrators (DBAs) and developers, you often encounter the following challenges:
In an AP scenario, long-running queries that process a large amount of data and perform complex calculations require real-time monitoring of their running status.
In a multi-node online environment, you need to determine whether a slow SQL statement is caused by a distributed execution plan issue and, if so, identify the long-tail node that hinders the performance of the entire plan.
You need to determine whether a slow SQL statement is caused by unrepresentative SQL parameters when the execution plan is generated or inaccurate statistics.
Distributed databases face more complex scenarios and involve more execution links than standalone databases. A single SQL statement may require collaboration among dozens of nodes. If a slow SQL statement cannot be resolved in time, it may cause blocking of normal requests, soaring CPU load, or even unavailability of the entire cluster.
Scenarios
As a native distributed database, OceanBase Database continuously enhances database management and operations efficiency, and optimizes diagnostic and tuning experiences. This topic will share best practices and insights of OceanBase Database in efficient diagnostics, including:
An exploration of execution performance challenges in AP scenarios and an introduction of common diagnostic tools.
A case study demonstrating how to use the real-time plan monitor to diagnose distributed plans.
Thoughts on simplifying and optimizing the diagnostic and tuning process, and an introduction to OceanBase's real-time SQL diagnostics.
Diagnostics for AP scenarios in OceanBase Database
Challenges in AP scenarios
In an analytical processing (AP) scenario, each execution involves a large amount of data, requires complex multidimensional modeling, and relies on large-scale parallelism to accelerate queries.
In this scenario, common performance issues in distributed databases include the following areas:
Scan large amounts of data.
Many analytical queries process a large amount of data, which often results in full table scans or scans of large data ranges. This causes high I/O and long response times. Poorly designed partitions may fail to be pruned, expanding the query range and causing unnecessary data scans. Partitions in OceanBase Database can be distributed across nodes or even data centers. Therefore, efficient data scanning across nodes or data centers is essential for cross-partition queries.
Aggregate and join multiple tables.
Complex aggregate functions: Aggregate functions such as COUNT, SUM, AVG, MAX, and MIN are frequently used in analytical scenarios. However, they can be very time-consuming to execute on large datasets.
GROUP BY processing: High-cardinality GROUP BY operations consume a large amount of memory and CPU resources, which undermines query performance.
Large JOIN operations: Analysis queries often involve joining multiple large tables. JOIN operations consume a large amount of memory and CPU resources. If the join condition is not properly chosen, the efficiency can be very low.
Unreasonable join order: If the optimizer chooses an unreasonable join order, the intermediate result sets will grow, which will degrade the query performance.
The parallel computing performance does not meet expectations.
AP business scenarios rely on high-performance computing to accelerate queries. However, if the parallel performance is suboptimal, it is unclear whether the issue is caused by insufficient system configuration or the SQL statement itself. In addition, since SQL statements executed in AP scenarios usually take a long time and their execution process is invisible to users, monitoring the real-time information and execution status of SQL statements is also a key feature in AP scenarios. These challenges require systematic diagnostic tools and optimization strategies to effectively address them and improve the performance and reliability of OceanBase Database in AP scenarios.
OceanBase diagnostic tools
To address these challenges, OceanBase Database offers a series of user diagnostic and tuning tools, including SQL Audit, End-to-end Trace, and DBMS_XPLAN.
For example, you can perform the following steps to diagnose SQL issues at the SQL level by using the SQL Audit view:
View the retry count: If the retry count is high, there may be a lock conflict or a switchover.
Check whether the queue time is long: If the queue time of a SQL statement is long, it will cause jitter. In this case, the SQL statement with a long queue time but a short execution time is usually affected by the jitter rather than the cause of the jitter. This is because the reason for the jitter is generally that a specific SQL statement takes a long time to execute, causing other SQL statements to wait in the queue for the CPU.
Check whether the execution plan acquisition time (GET_PLAN_TIME) is long: If yes, the SQL statement did not hit a plan but went through the entire plan generation process again, and generally,
IS_HIT_PLAN=0.Check if EXECUTE_TIME is long: If it is, you can use SQL to check for long-running wait events. For example, if you find that the SQL spends a significant amount of time waiting for I/O, you can investigate whether the disk status was normal during the spike period.
Real-time performance bottleneck analysis with SQL Plan Monitor
Although OceanBase Database provides various diagnostic tools, AP scenarios still lack execution monitoring at the SQL operator level. For example, it is unclear how the execution tasks are divided in a parallel operation, whether data skew occurs, how severe the hash conflicts are, and which operator the execution is hung on. These issues can be identified only from logs.
If a summary analysis of an SQL query is completed but the slow SQL query is still not identified, the problem might be with the SQL query itself rather than the scheduling. In this case, you can use the SQL_PLAN_MONITOR view for operator-level analysis.
The SQL_PLAN_MONITOR view is a powerful tool for real-time monitoring of the execution of SQL statements. It allows you to understand the resource consumption and execution status of an SQL statement during execution, including the number of concurrent operators, rows produced by each thread, number of scanned rows, and actual execution time. You can use this information for further diagnostics.
Query performance bottleneck
The SQL_PLAN_MONITOR view records the output rows and execution time of each operator during execution. These are the first data items to be checked for performance diagnostics. Generally, you can identify the slowest operator based on the number of threads (concurrency) used by each operator, the total number of rows output, and the timestamps for first and last row output.
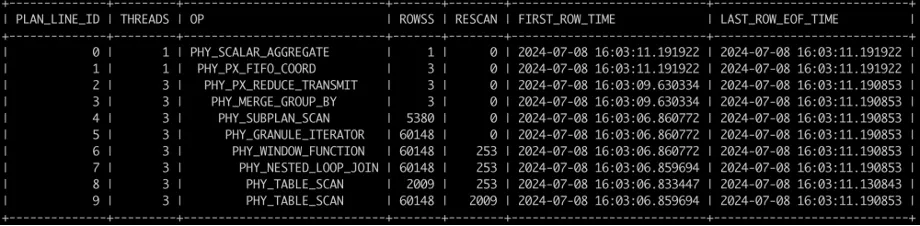
Take the TPC-H Q17 as an example. The execution record is as follows:
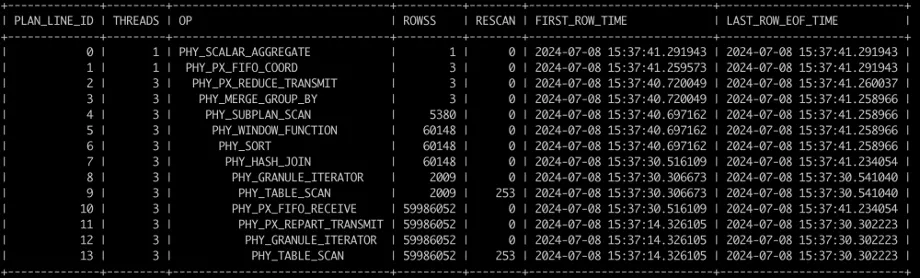
Based on the data in the figure and the execution plan, you can see that the scan of the LINEITEM table and the HASH JOIN with operator ID 7 are the bottlenecks of this execution. The scan of the PART table is completed quickly. In this case, you can add a index to the join column of the right table.
After the index is added, the execution record is as follows. The join strategy is changed from HASH JOIN to NLJ to avoid a full-table scan of the LINEITEM table. The execution time is reduced from 30s to 4s.
Real-time I/O data
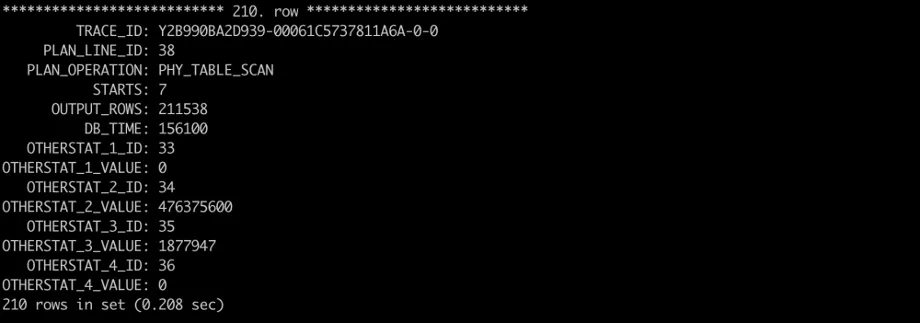
In version 4.2.4 and later, the SQL_PLAN_MONITOR view allows you to view the timing and I/O data of each thread of an operator in real time. You can obtain the I/O data from the OTHERSTAT_x_KEY and OTHERSTAT_x_VALUE columns. The correspondence between the keys and values is described in the V$SQL_MONITOR_STATNAME view. The I/O-related fields in the view are as follows:
33: total io bytes read from disk
34: total bytes processed by ssstore
35: total rows processed by ssstore
36: total rows processed by memstore
A snippet of the data is as follows. It shows that all data of the operator is scanned from SSTables, and less than 1% of the scanned rows are output. This means that the query needs to be optimized for the table, for example, by adjusting the filter condition or creating an index on the filter column.
Load imbalance
When data is unevenly distributed across distribution nodes, some nodes may be overloaded with a large amount of data processing tasks, while other nodes have almost no workload. This causes single-point bottlenecks and degrades overall performance.
For example, a large table has dozens of partitions. If 90% of the data, which is the peak data of one day, is concentrated in one partition, the data in this partition accounts for 90% of the total data. In this case, if you parallelize the task of counting the different values of a specified column and each thread calculates the results of some partitions, you can imagine the parallel execution effect: threads finish their tasks on smaller partitions much earlier, but a thread responsible for a larger partition needs a long time to complete its task. Other partitions have to wait for this thread to finish its task. This causes low overall performance. The parallel execution efficiency is very low in this case because the workload of each thread is unbalanced.
In actual business scenarios, you can use the SQL_PLAN_MONITOR view to diagnose load imbalance issues. The view records the details of each thread on every node. If parallel execution performance is not as expected, you can compare the records of the same operator and different threads to identify whether there is a straggler slowing down the entire execution process.
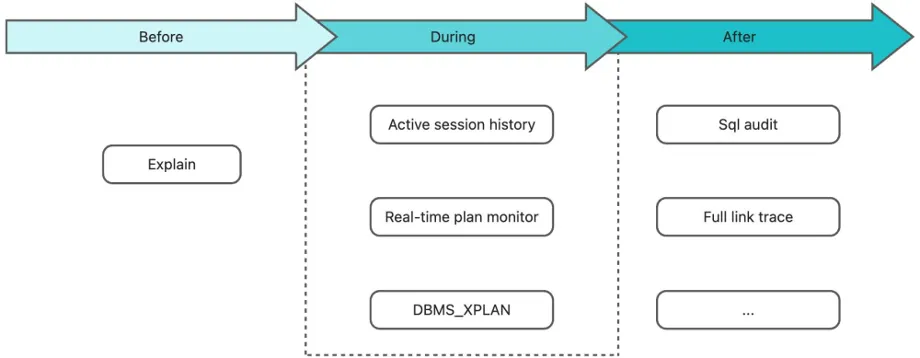
Real-time SQL diagnostics in OceanBase Database
Challenges for developers in analyzing slow SQL queries
Although OceanBase Database currently offers some diagnostic and tuning tools, there are still some challenges, especially for developers:
The complexity of using multiple steps and tools requires in-depth knowledge of databases and OceanBase Database kernels.
The diagnostic and tuning process is complex and cumbersome, involving the management and maintenance of a large number of SQL queries and scripts.
High learning costs. Effective SQL diagnostics require professional training and substantial experience.
Real-time SQL execution analysis
To address these challenges and further improve the real-time and accuracy of SQL diagnostics, OceanBase Database has introduced the new Query Profile (execution analysis) feature in ODC V4.3.1. Query Profile visualizes the real-time SQL plan monitor feature in OceanBase Database V4.x. It can query and display the execution status of actual plans in real time during SQL execution, and details the execution time and resource usage of each operator in the plan.
With the execution analysis feature, combined with the existing visualization features of ODC for execution plans and end-to-end tracing, users can easily identify execution bottlenecks and understand the performance overhead of each operation to analyze and optimize query performance. The execution analysis feature helps answer the following key questions:
How much data is to be processed?
Where are the bottlenecks?
Which columns are most frequently used in filters and joins?
Do these columns filter out most data or do they always extract most rows?
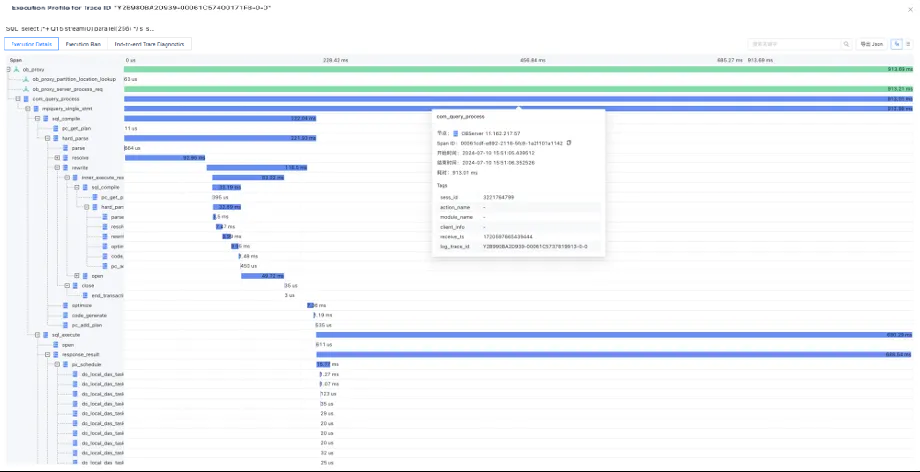
The TPC-H Q15 statement queries the top supplier (ranked first) that contributes the most to the total income within a specified period of time. This information can be used to decide which top suppliers to reward, to give more orders to, to certify specially, or to encourage. The Q15 statement is a complex statement that involves a join between a table and a view, and the join involves grouping, sorting, aggregation, and subqueries. Use this example to learn about the features and structure of the execution analysis feature. After the statement is executed in ODC, click the Execution Profile button in the result pane.
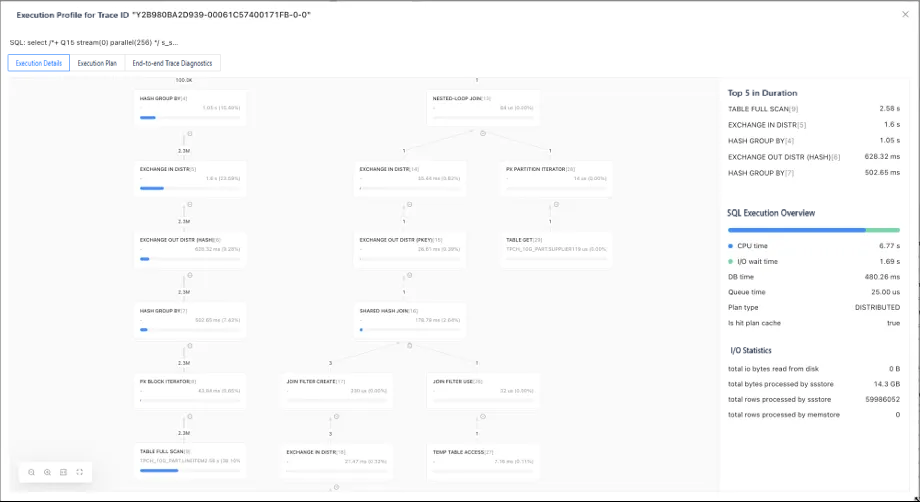
In the execution overview section of the pane that appears, you can see basic information about the SQL execution, such as whether the execution plan is a distributed plan, whether the plan is cached, and the total execution time. This information can be used as the background for diagnostics.
The graphical view details the scheduling order of the execution plan. Generally, you can read the execution plan from bottom to top. However, the execution analysis feature in ODC highlights the CPU costs actually spent by each operator with a blue progress bar and sorts the most time-consuming five nodes, making it much easier to identify performance bottlenecks. Based on the preceding visual views, you can quickly draw the following conclusions:
The time spent at each node: The time spent is the key to identifying performance issues. You can quickly identify bottlenecks from the total execution time of each operator and analyze the causes. In the preceding example, the longest-running node in the query is the scan node of the "LINEITEM" table. You can also see that the main performance bottleneck lies on the left side of the root node.
The number of rows output at each node: The LINEITEM table outputs approximately 2.3 million records, while the other operators output no more than 1 row on the right side.
With some basic information and an understanding of the general performance bottleneck, you can dive into the second part of the execution analysis: I/O statistics and operator attributes.
As shown in the right-side part of the preceding figure, the overview section displays the overall query information. Key simple metrics that you can view include the total CPU time, the total I/O time, the actual execution time, and the number of rows and bytes read (how much data to process, which is key). These metrics are the starting point for diagnostics. Generally, they can help you resolve most queries. In the preceding example, you can observe a key finding in the graph: The bottleneck lies in the left subtree of the plan. Click the "TABLE FULL SCAN" node, which is the identified bottleneck, to view the execution details of the operator as shown in the following figure:
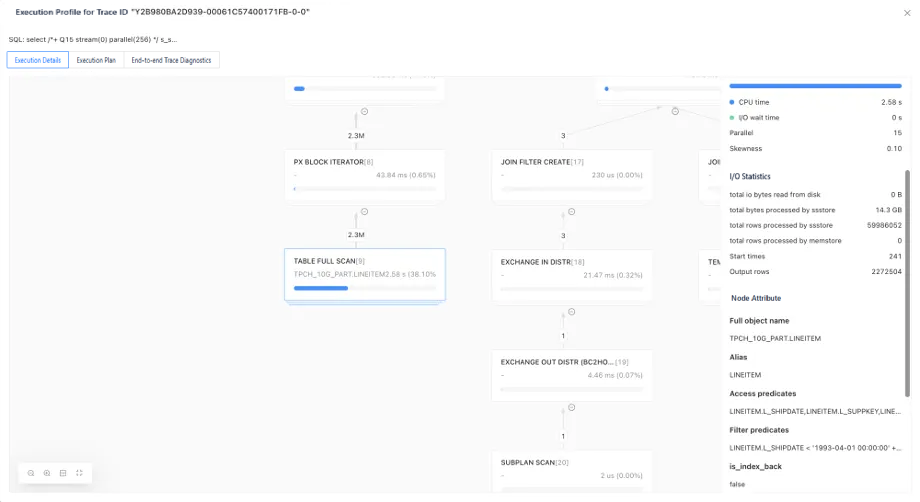
The total rows processed by ssstore field in the I/O statistics section on the right side of the pane indicates that the current node has performed a full table scan. This scan did not use an index, even though an index has been created on the L_SHAPEDATE column. This may be because the optimizer evaluates that an index scan would process more rows.
The shape of the node indicates the type of the operator. In this example, the operator is a distributed operator. The execution overview shows that the parallelism of the operator is 15 and the skewness is 0.1. A small skewness indicates that the workload is evenly distributed among threads and that there are no long-tail nodes that slow down the overall performance.
If you want to query the details of each thread, you can switch to the thread view on the right side and view the row output, the time spent, and the number of rescans of each thread. ODC allows you to sort threads by time, memory, or row output to quickly locate bottleneck threads.
In addition, ODC V4.3.1 has comprehensively redesigned the SQL diagnostics-related features. It provides the execution analysis, execution plan, and end-to-end diagnostics views on one interactive page, supports multiple view modes, and enhances the efficiency of identifying distributed query issues.