


During database operation, various exceptions may occur, such as application errors, database connection errors, database permission issues, database resource issues, and network problems. One of these exceptions is an application exception, where the error message contains an OceanBase error code.
To help you quickly identify the root cause of such issues and efficiently resolve them, we have summarized a clear and practical troubleshooting process for application exceptions with error messages containing OceanBase error codes. This process provides explicit steps to enhance troubleshooting efficiency and minimize business impact, offering strong support for daily O&M work.
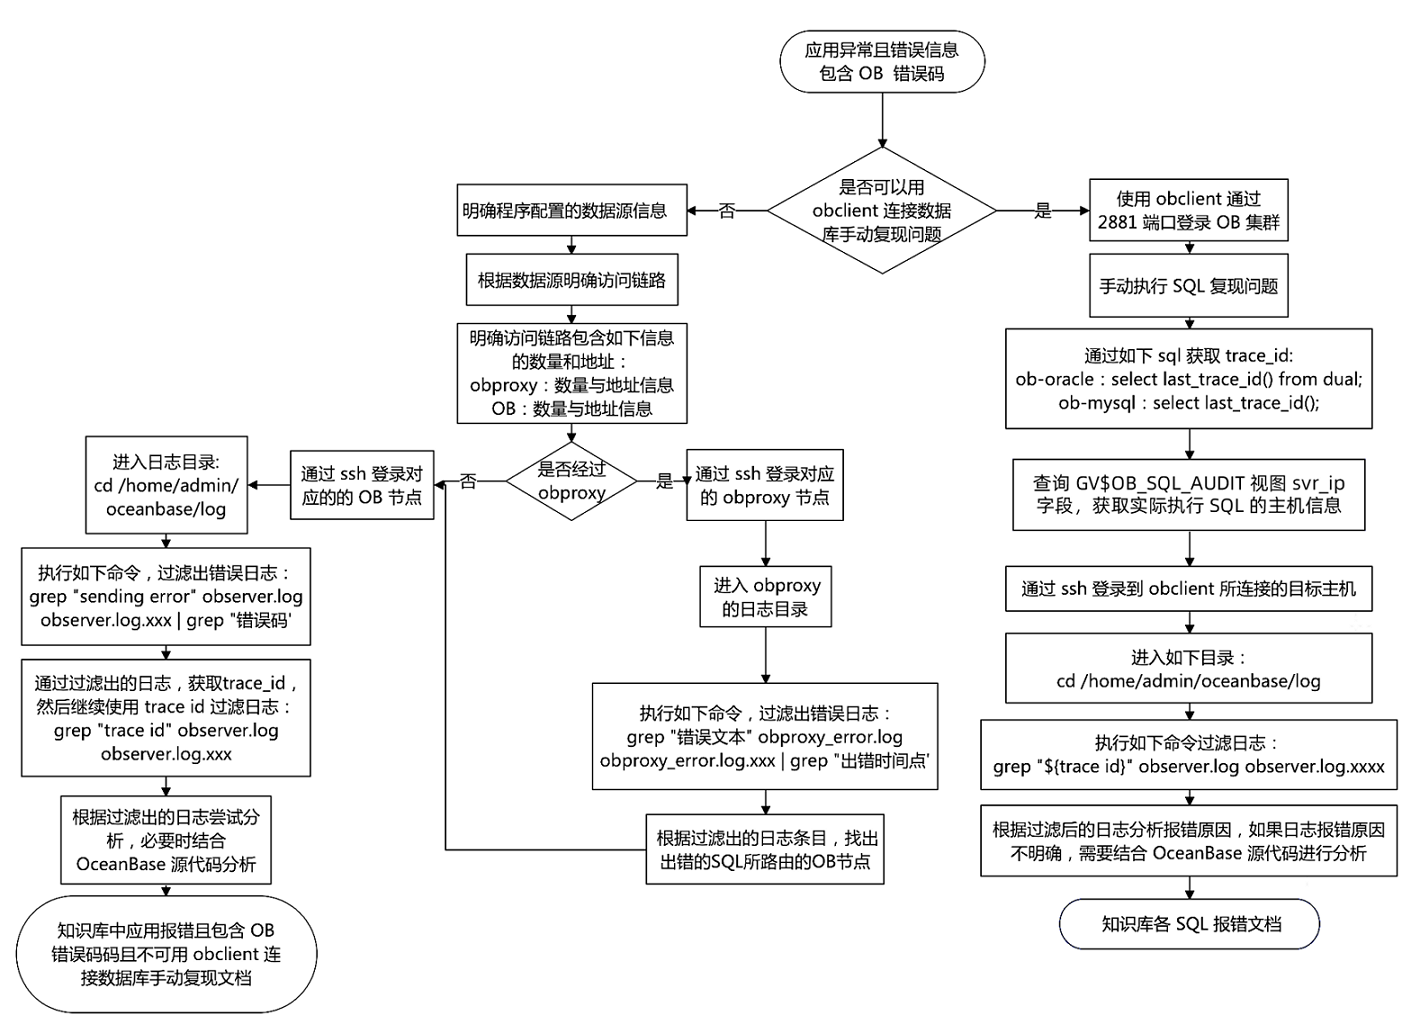
The troubleshooting process for an application exception with an error message containing an OceanBase error code is shown in the following figure.
Procedure
When an application execution exception is reported with OceanBase error codes, you can troubleshoot the issue by following this procedure.
First, determine whether you can use OBClient to connect to the database and manually reproduce the issue:
If yes, connect to the database after the issue is reproduced for further troubleshooting.
If not, troubleshoot the program configuration's data source information.
Troubleshoot the issue by reproducing it
Use OBClient to connect to the OceanBase cluster at port 2881 (the default SQL port). If the port is customized, replace 2881 with the actual port number.
Manually execute the SQL statement that returns an error to reproduce the issue.
Execute the following statement to obtain the
trace_id.Notice
You must execute the following statement immediately after the SQL statement that returns an error is executed; otherwise, the
trace_idof the SQL statement that returns an error cannot be obtained.MySQL modeOracle modeThe following statement is used to obtain the
trace_idin MySQL mode:obclient> SELECT last_trace_id();The following statement is used to obtain the
trace_idin Oracle mode:obclient> SELECT last_trace_id() FROM DUAL;Obtain the host information where the SQL statement is actually executed.
OceanBase clusters are generally deployed across multiple nodes. You can execute the following SQL statement to obtain the node where the SQL statement is actually executed and then filter logs based on the node.
MySQL modeOracle modeExecute the following statement in MySQL mode:
obclient> SELECT * FROM oceanbase.GV$OB_SQL_AUDIT WHERE trace_id=last_trace_id;Replace
last_trace_idwith thetrace_idobtained in the previous step.Execute the following statement in Oracle mode:
obclient> SELECT * FROM SYS.GV$OB_SQL_AUDIT WHERE trace_id=last_trace_id;Replace
last_trace_idwith thetrace_idobtained in the previous step.According to the query result of the
GV$OB_SQL_AUDITview, the host corresponding tosvr_ipis the host where the SQL statement is actually executed.Use the
sshcommand to log in to the host based on the obtained host information.Go to the log directory.
Assume that the installation directory of OceanBase Database is
/home/admin/oceanbase. The following example shows the specific path where logs are stored.cd /home/admin/oceanbase/logExecute the following command to filter the required information from the logs.
grep "${trace_id}" observer.loggrep "${trace_id}" observer.log.xxxReplace
${trace_id}with thetrace_idobtained earlier. Replaceobserver.log.xxxwith the log file with a timestamp, wherexxxis the actual timestamp when the SQL statement is executed based on the error reproduced.Based on the information provided in the logs and error messages, analyze the issue.
For more information about logs, see Overview. If the information in the logs is unclear, contact technical support for assistance.
Troubleshoot the data source configuration
Based on the data source, identify the access link.
The access link contains the following information:
The number and addresses of OBProxies
The number and addresses of OBServer hosts
Determine whether OBProxy is involved.
If yes, follow these steps to further troubleshoot the issue:
Run the
sshcommand to log in to the corresponding OBProxy node.Run the
cdcommand to go to the log directory of OBProxy. The OBProxy logs are stored in the/logdirectory under its installation directory.Run the following command to filter out the error logs:
grep "Error text" obproxy_error.log obproxy_error.log.xxx | grep "Error time"Identify the OBServer node to which the SQL statement that caused the error is routed based on the filtered log entries.
Run the
sshcommand to log in to the corresponding OBServer node for further troubleshooting.
If not, follow these steps to further troubleshoot the issue:
Run the
sshcommand to log in to the corresponding OBProxy node.Go to the log directory.
Assume that the installation directory of OceanBase Database is
/home/admin/oceanbase. The specific log path varies by environment.cd /home/admin/oceanbase/logRun the following command to filter out the error logs:
grep "sending error" observer.log observer.log.xxx | grep "Error code"Obtain the trace_id from the filtered logs, and then filter the logs again based on the trace_id.
grep "trace id" observer.log observer.log.xxxAnalyze the issue based on the information provided in the logs and the error messages.
For more information about logs, see Overview. If the information in the logs is unclear, contact technical support for assistance.
Case studies
- A regular user of a regular business tenant encountered the error
ERROR 1040 (08004): Too many connectionswhile directly connecting to port 2881 of OceanBase Database. For more information, see Troubleshoot when the error ERROR 1040 (08004): Too many connections is returned.