


DOOBA is an O&M script in OceanBase Database for performance monitoring. It is developed in Python and supports only Python 2.7. This topic describes how to use DOOBA to monitor the performance of OceanBase Database.
Usage
After you connect to the sys tenant of OceanBase Database by running a MySQL command, you can run DOOBA to display the queries per second (QPS) and the average response time (RT) of the SQL statements executed in the tenant in real time. The supported SQL types include SELECT, UPDATE, INSERT, DELETE, and COMMIT. You can also view the QPS and RT of SQL statements executed on each OBServer node.
You can view the dooba.py script file of DOOBA in the open source community of OceanBase Database.
To run DOOBA, you must use a MySQL client.
Note
ODP earlier than V2.0.0 may not be fully compatible with the connection protocol of MySQL 8.0. Therefore, we recommend that you install a MySQL client with a version of 5.5, 5.6, or 5.7.
Run the following command to use DOOBA:
python dooba.py -h ODP address -u root@sys#cluster name -P ODP port number -p password

// For example:
python dooba.py -h xxx.xxx.xxx.xxx -u root@sys#obce-3zones -P 2883 -p******
After you log on to DOOBA, you can use the following shortcut keys:
c: selects a tenant to display its performance.1: displays all shortcut keys.Notice
We recommend that you do not use shortcut keys that are not listed in Help, because their functionalities are not guaranteed.
2: displays the performance information of the tenant.3: displays the performance information about each OBServer node in the tenant. Only the performance information about some OBServer nodes is displayed if the tenant has a large number of OBServer nodes.tab: switches between widgets.d: deletes the widget where the tab focus is located.R: restores all widget layouts of the current page, including the deleted ones.Note
You can run the
vim dooba.pycommand to view and edit the source code of the DOOBA script. The abbreviations used in the tool are explained in the source code.
Tenant performance overview
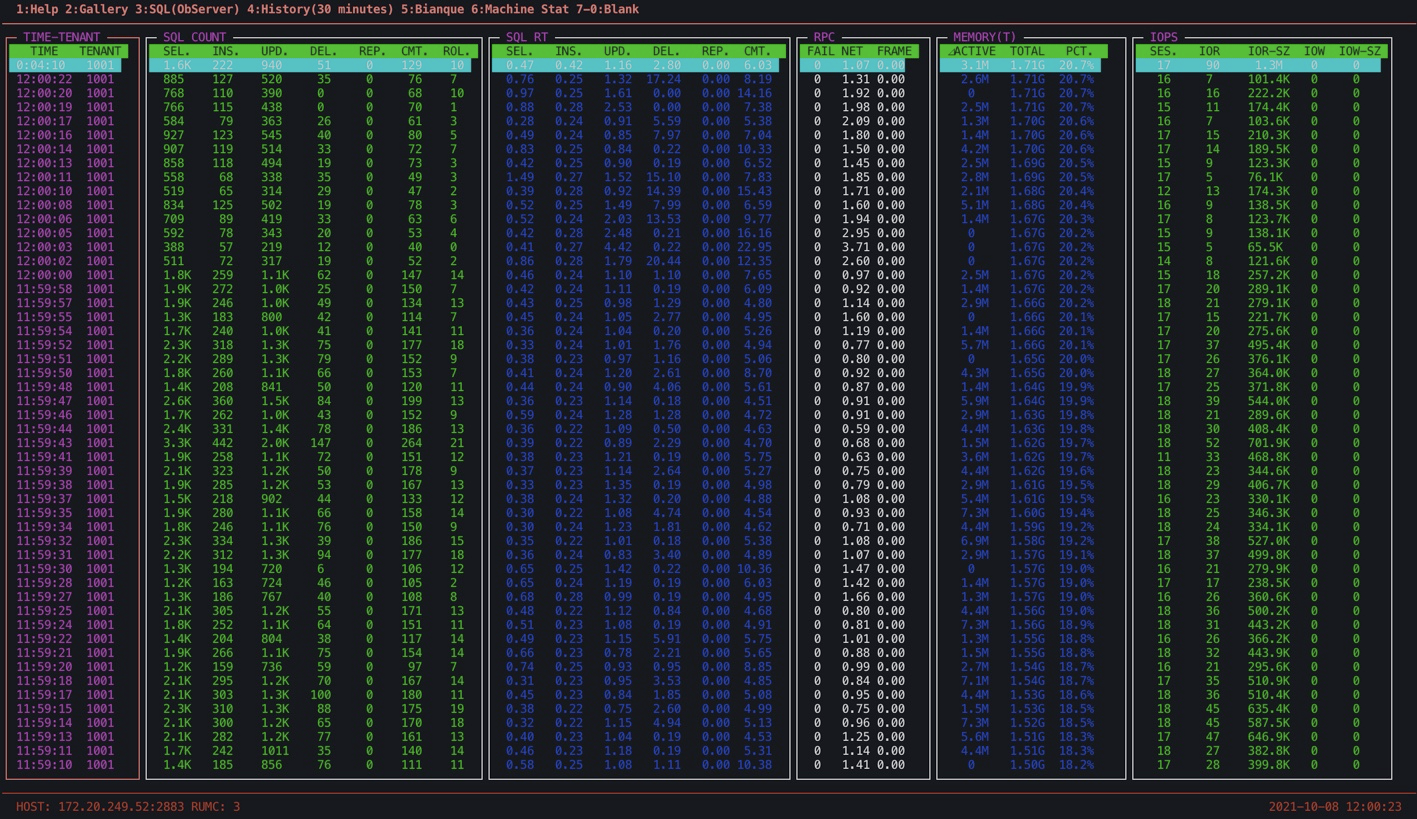
You can use the shortcut key 2 to view the real-time information about the tenant, including the QPS, RT, memory usage, and I/O of SQL statements executed in the tenant.
DOOBA fetches the performance data from the gv$sysstat view of the sys tenant. You can execute SQL statements to view the monitoring data of DOOBA and develop similar monitoring tools based on DOOBA.
# Obtain the QPS and RT information
SELECT t1.con_id tenant_id,t2.zone, t1.svr_ip,t1.svr_port , t1.stat_id, t1.name, t1.value
FROM gv$sysstat t1 JOIN  __all_server t2 ON (t1.svr_ip=t2.svr_ip and t1.svr_port=t2.svr_port) JOIN __all_resource_pool t3 ON (t1.con_id=t3.tenant_id) JOIN __all_unit_config t4 ON (t3.unit_config_id=t4.unit_config_id)
WHERE  t1.con_id IN (1001)
and stat_id in (10000,10004,10005,10006,30007,30008,30009,40000,40001,40002,40003,40004,40005,40006,40007,40008,40009,40010,40011,40012,40013,50000,50001,50002,50003,50004,50005,50006,50007,50008,50009,50010,50011,60000,60002,60003,60005,130000,130001,130002,130004)
ORDER BY t1.con_id, t2.zone, t1.svr_ip, t1.svr_port;
You can execute the preceding SQL statements to obtain the performance data of all OBServer nodes and put it together to present the performance data of the entire tenant.
Note the following metrics on this page:
SQL COUNTThe number of SQL queries executed per second. The displayed SQL types are SELECT, INSERT, UPDATE, DELETE, REPLACE, COMMIT, and ROLLBACK.
You can estimate the average number of SQL statements for transactions based on the ratio of the total number of the first four types of SQL statements to the number of COMMIT statements. A large number of ROLLBACK statements is likely the result of database errors or problematic business design.
SQL RTThe average time consumed to execute an SQL statement. Unit: milliseconds. The displayed SQL types are SELECT, INSERT, UPDATE, DELETE, REPLACE, and COMMIT.
From the values of the first four types of statements, you can learn about the time consumed to execute SQL statements in normal conditions. Significant fluctuations may be caused by spikes in data volumes, the lack of indexes for SQL statements, lock waits, or CPU bottlenecks. You must troubleshoot the problem based on the
gv$sql_auditview.The average RT of COMMIT statements also reflects the size of transactions. A COMMIT statement of OceanBase Database synchronizes all clogs of a transaction to the majority of OBServer nodes in the cluster, including the OBServer node on which the statement is executed. The time consumed for synchronization is included in the RT of the COMMIT statement. Therefore, a drastic increase in this value is likely a sign of a large transaction. The RT of a COMMIT statement also increases when the network performance of OBServer nodes degrades or the time synchronization error increases.
RPCThe network information. This metric will be improved later. You can ignore it for now.
MemoryThe real-time memory usage of the MemStore. By default, half of the memory available for the tenant is allocated to the MemStore, which stores changed data generated by business write operations.
OceanBase Database records only data changes and stores this part of data in the memory until the memory usage of incremental data reaches the threshold value that you specified for the
freeze_trigger_percentageparameter. When the memory usage exceeds the threshold, a minor compaction or major compaction is triggered to write the data to the disk and release the memory.The concepts of minor compaction or major compaction:
- In a minor compaction, the incremental data in the memory is directly written to the disk for temporary storage. Similar to a
checkpointevent in a conventional database, a minor compaction has quite limited impact on tenant performance and the impact can be optimized. - In a major compaction, the incremental data in the memory is merged with the baseline data on the disk to produce the latest
SSTable. Then, data in the SSTable is written to the data files. A major compaction has a slightly greater impact on tenant performance and can also be optimized.
We recommend that you perform minor compactions where necessary and perform major compactions only during off-peak hours early in the morning. You can schedule automatic major compactions or manually trigger them. However, when minor compactions have been performed the number of times that is specified for the
minor_freeze_timesparameter, a major compaction is also automatically triggered.The Memory metric shows changes in the incremental (active) memory, total memory, and percentage of incremental memory usage. You can identify all issues of insufficient incremental memory by combining the monitoring results and the
gv$mem_storeview.- When the memory usage reaches the threshold value of the
freeze_trigger_percentageparameter, a minor compaction is triggered. - When the memory usage further increases to the threshold value of the
writing_throttling_trigger_percentageparameter, write throttling of the tenant is triggered. - When the memory usage approaches 100%, which means that the tenant memory is exhausted, the
Over tenant memory limit1error will be frequently returned for data writes.
You can tune the
freeze_trigger_percentageparameter and the concurrency of minor compaction tasks to keep memory usage of the tenant within a reasonable and safe range.- In a minor compaction, the incremental data in the memory is directly written to the disk for temporary storage. Similar to a
IOPSThe real-time disk I/O operations per second (IOPS).
SESS: the number of sessions. The value is for your reference only because it may be inaccurate in the case of a large number of sessions.IOR: the read IOPS.IOR-SZ: the throughput of read I/O operations. When the data is read for the first time or does not exist in the memory, it leads to physical read I/O operations. High physical read I/O traffic leads to a high average RT of SQL statements. In this case, the memory is insufficient and the I/O dependency is high, which may lead to an I/O bottleneck.IOW: the write IOPS.IOW-SZ: the throughput of write I/O operations. Generally, data is written to the memory of OceanBase Database. Intensive write I/O operations are involved only during a minor compaction or major compaction.
Performance overview of OBServer nodes in a tenant
You can use the shortcut key 3 to display the performance overview of OBServer nodes in a tenant, including the QPS, RT, and cache hit rate of SQL statements on each OBServer node in the tenant.
# Obtain the CPU utilization of an OBServer node
SELECT t1.con_id tenant_id,t2.zone, t1.svr_ip,t1.svr_port , round(t1.value/(100*t4.max_cpu), 3) cpu_usage
FROM gv$sysstat t1 JOIN  __all_server t2 ON (t1.svr_ip=t2.svr_ip and t1.svr_port=t2.svr_port) JOIN __all_resource_pool t3 ON (t1.con_id=t3.tenant_id) JOIN __all_unit_config t4 ON (t3.unit_config_id=t4.unit_config_id)
WHERE  t1.con_id IN (1001) and t1.stat_id=140006
ORDER BY t1.con_id, t2.zone, t1.svr_ip, t1.svr_port;

Note the following metrics on this page:
Active sessions
The number of active sessions. The value may not be accurate and is for your reference only.
CPU
The CPU utilization of each OBServer node in OceanBase Database. rather than the CPU utilization of your OS. The OceanBase software has a single-process architecture.
Cache-Blk Hit, Cache-BI Hit, Cache-Loc Hit, and Cache-Row Hit
The
cache block(Cache-Blk),cache block index(Cache-BI), cache lock (Cache-Loc), and cache row (Cache-Row) hit rates. You must pay attention to theCache-Blkhit rate. Ideally, the value is 99% or 100%. However, the value may be less than 99% or even 90% when a large amount of data is read for the first time, a memory bottleneck is reached, or a major compaction is performed. If the value stays below 80%, it indicates a serious memory bottleneck. You can ignore other cache hit rates.IO-R and IO-W
The physical read I/O (IO-R) and write I/O (IO-W) of each OBServer node. These two metrics provide very useful information.
QPS and RT of SQL statements
QPS of each OBServer node shows the percentage of tenant requests on each OBServer node. Accordingly, RT indicates the performance of each OBServer node.
The SLC and SRC columns indicate the number of executions of the local and remote SQL statements on the OBServer node. Generally, the execution performance of local SQL statements is better than that of remote SQL statements.
Therefore, a larger proportion of remote SQL statements is likely to cause relatively high average CPU utilization and RT of the OBServer node. In this case, you must analyze the causes. A possible cause is that multiple zones are set as the
PRIMARY_ZONEof the tenant when it is not suitable to do so, or the table structure is not reasonably designed. To solve the problem, you can try grouping the tables or adjusting the configuration of thePRIMARY_ZONEorUNIT_NUM.