


Alert description
This alert is triggered when the network bandwidth usage on the server hosting the OBServer node exceeds the threshold during data transmission.
Alerting principle
The following table describes the key parameters involved in the alerting monitoring logic.
Parameter |
Description |
|---|---|
| Monitoring metric | ob_host_net_send_percent |
| Data source | http://localhost: 63000/metrics. |
| Metric to be collected | node_network_transmit_bytes_total and bandwidth |
| Monitoring expression | 100 × max(sum(rate(node_network_transmit_bytes_total{@LABELS}[@INTERVAL] ) by (device,@GBLABELS)) by (device,@GBLABELS) / sum(bandwidth{@LABELS}) by (device,@GBLABELS)) by (@GBLABELS) |
| Collection interval | 1 second |
Note
The data source of this alert is special. OCP-Agent monitors the network usage of the local host. The data is collected by using the python script and the exporter process. For more information, see the description of Data source in the table.
The value of the monitoring metric ob_host_net_send_percent indicates the percentage of the network bandwidth occupied by the OBServer node. An alert is triggered when the value exceeds the threshold (80% by default).
Rule Information
Monitoring Metric |
Default Threshold (unit: %) |
Duration |
Detection Cycle |
Elimination Cycle |
|---|---|---|---|---|
| ob_host_net_send_percent | 80 | 120 seconds | 60 seconds | 5 minutes |
Alert Information
Alert Trigger Method |
Alert Level |
Scope |
|---|---|---|
| Expression-based on Monitoring Metrics | Critical | Server |
Alert Template
Alert Overview
- Template: ${alarm_target} ${alarm_name}
- Example: ob_cluster=obcluster-1:svr_ip=xxx.xxx.xxx.xxx Server Network Send Bandwidth Usage Exceeded
Alert Details
- Template: Cluster: ${ob_cluster_name}, Host: ${host}, Alert: ${alarm_name}. The value of the monitored metric is ${value_shown}, which exceeds ${alarm_threshold} %.
- Example: Cluster: obcluster-1, Host: xxx.xxx.xxx.xxx, Alert: Server Network Send Bandwidth Usage Exceeded. The value of the monitored metric is 81.0 %, which exceeds 80.0 %.
Clear Alert
- Template: Alert: ${alarm_name}, Server Network Send Bandwidth Usage: ${value_shown}
- Example: Alert: Server Network Send Bandwidth Usage Exceeded, Server Network Send Bandwidth Usage: 75 %
Impact on the System
When the network bandwidth is about to be exhausted, the performance of OceanBase Database will be bottlenecked. When the business workload continues to increase, the performance of OceanBase Database will be unable to meet the business needs.
Possible Causes
This is common when the business workload of OceanBase Database increases, such as when the amount of data returned by SQL statements is excessively large.
Solution
Go to the Monitoring page of the host in OCP and view the Network Throughput section on the Host Performance tab.
Observe the network throughput during the alert period.
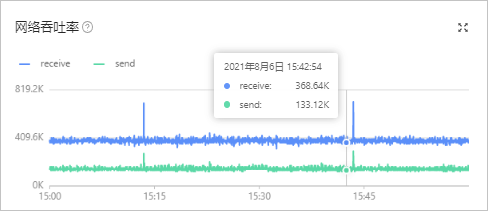
If the network throughput suddenly spikes, it may be due to a surge in short-term business workload.
You can wait for the business workload to return to normal and then observe whether the alert is automatically eliminated after 5 minutes.
If the network throughput curve is gradually rising or the network throughput suddenly spikes and does not decrease, it may be due to normal business expansion.
Contact the network engineer to increase the network bandwidth of the host.