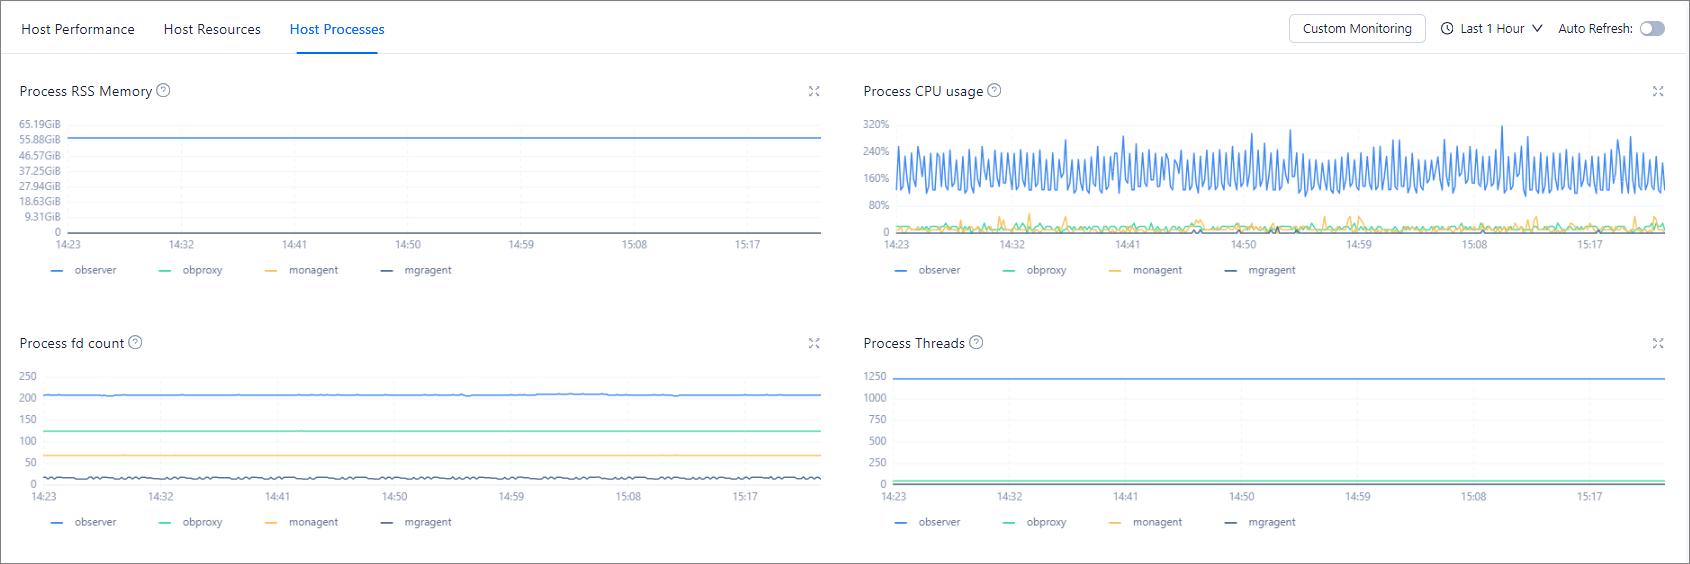
This topic describes the host process monitoring feature of OceanBase Cloud Platform (OCP).
Prerequisites
You have the read-only permission on the target host.****
Procedure
Log on to the OCP console.
Click Hosts.
In the Hosts list, find the target host and click its IP address.
On the page that appears, click the Monitoring tab.
On the Monitoring tab, click the Host Processes tab to view the monitoring data of host processes.

- If Auto Refresh is disabled, you can click Last 1 Hour and then select a time range to view the monitoring data of the last hour, last day, last week, or a custom time range.
- If Auto Refresh is enabled, the system displays the real-time monitoring data of the host.
For more information about the meaning and value source of all metrics on the tab, see Overview of metrics. The following figure and instructions describe how to view and analyze the process monitoring data in the trend charts.

Hide the data of a submetric: To use this feature, click the icon of this submetric. The submetric will then turn gray and its data will be hidden from the chart, as indicated by ① in the preceding figure.
View detailed data of a specific point in time or a period of time: You can hover the pointer over a point in time on the trend chart to view the detailed data. You can also drag the pointer to select a period of time on the trend chart and have a zoomed-in view of data in this period of time. To resume the normal view, double-click the trend chart.
Zoom in on the trend chart: To use this feature, click the zoom-in icon in the upper-right corner, as indicated by ③ in the figure. The features indicated by ① and ② in the preceding figure are also applicable to a zoomed-in chart.

