This topic describes how to use the capacity center.
Applicability
This topic applies only to OceanBase Cloud Platform (OCP) Enterprise Edition. OCP Community Edition does not support the capacity center feature.
Procedure
Log on to the OCP console.
In the left-side navigation pane, click OceanBase Autonomy Service.
In the Cluster Details section, click the name of the cluster that you want to view.
In the left-side navigation pane, click Capacity Center to view the related information as follows:
View the cluster capacity risks. The current capacity check items include the tenant CPU utilization, memory usage, disk usage, and number of connections.
Click View to go to the Resource Usage Tendency section and view the resource usage trends.

Check the capacity usage overview, including the CPU utilization, memory usage, disk usage, and estimated number of days for which the remaining disk capacity is sufficient.

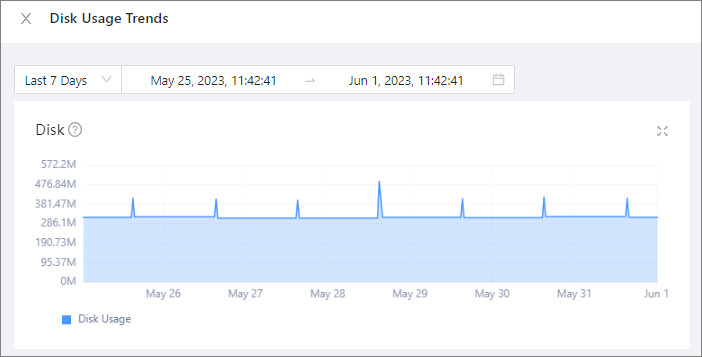
In the Disk section, click View Usage Trends. In the panel that appears, select a time range to view details about disk usage within the specified period.

View the usage details of tenants in the last seven days. The list shows the resource specifications of all tenants in the cluster, the number of connections, CPU utilization details, memory usage details, and disk usage details of each tenant.

View the tenant capacity.
You can filter the statistics by tenant, database, and table group.
You can view the trends of disk usage, number of partition replicas, CPU utilization, and memory usage in the selected time range.
You can select Last 7 Days, Last 30 Days, Last 6 Months, or Last 1 Year or specify a custom period as the time range to view the status of a specified tenant, database, or table group. Note that the trend charts of CPU utilization and memory usage are available only at the tenant level.
You can sort databases and table groups by Data Amount or Disk Usage.
For more information, see Tenant resource management.


