This topic describes how to view performance monitoring of sql diagnostics.
Prerequisites
Make sure that you have the following permissions:
- Resource Permissions: Cluster Read-only or Tenant Read-only permission
- Menu Permissions: Permission on the Real-time Diagnostics menu of OceanBase Autonomy Service
Procedure
Log on to the OceanBase Cloud Platform (OCP) console.
In the left-side navigation pane, click Autonomous service.
In the Cluster Details section, click the name of the target cluster.
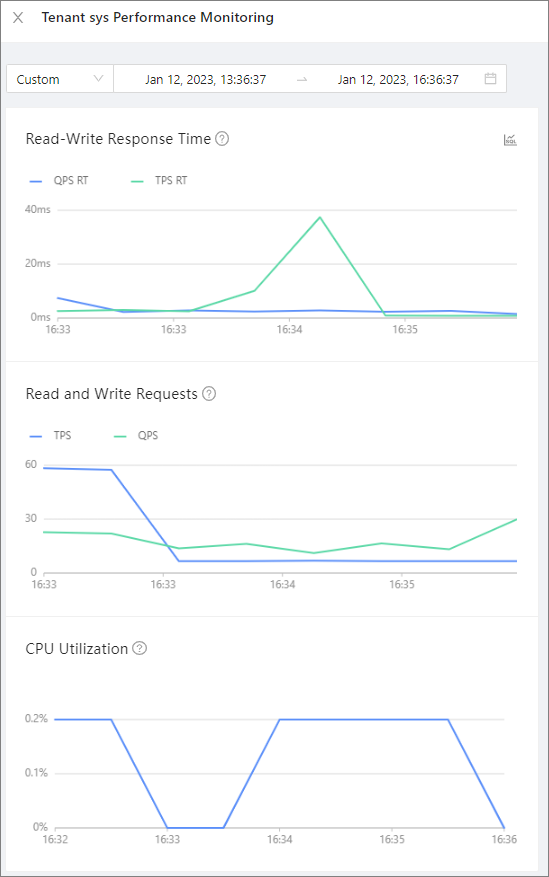
By default, the SQL Diagnostics tab of the Real-time Diagnostics page appears. Click View Performance Monitoring. In the panel that appears, you can view the trend charts of the read/write response time, number of read/write requests, and CPU utilization for the tenant within a specified period of time. For more information, see Performance monitoring.