


A tenant is a logical concept that represents a resource allocation unit in ApsaraDB for OceanBase. It is the basis for the management of database objects and resources. It is critical for system O&M, especially for the O&M of cloud databases.
After you log on to the OceanBase Cloud Platform (OCP) console, you can click Tenants in the left-side navigation pane to go to the Tenants page, where you can obtain the tenant overview information. By default, the page displays a list of tenants that you have the permission to view, and displays the performance monitoring charts of the top 5 tenants. You can also perform tenant management operations on this page. For more information, see Manage unit specifications, Create a tenant, Lock a tenant, and Copy a tenant.
Tenants
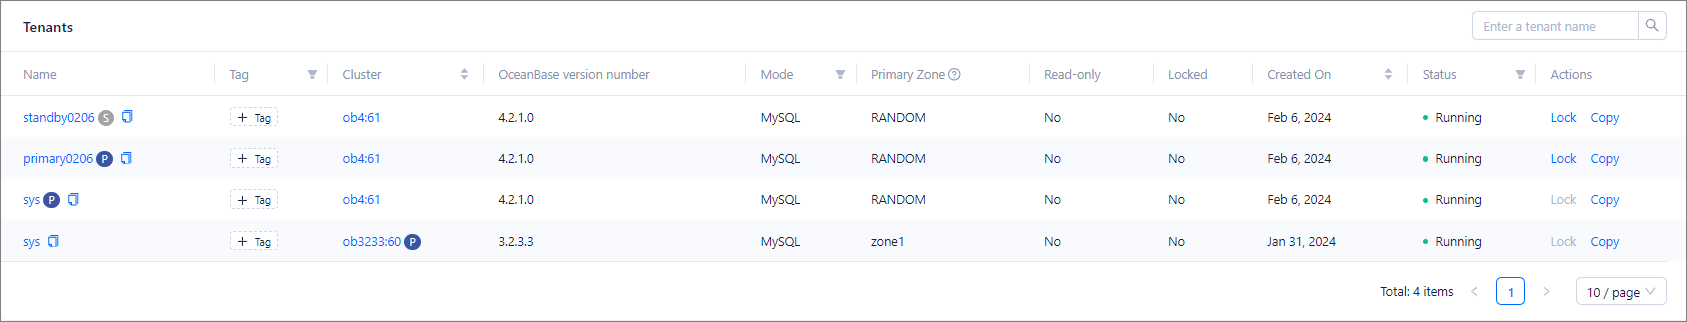
On the Tenants page, you can view tenant information in the following columns: Tenant Name, Tag, Cluster, OceanBase version number, Mode, Primary Zone, Read-only, Locked, Status, and Created On. The Actions column provides options for you to perform related operations on tenants. You can query tenants by name in batches, and the tenant names are separated with spaces.
You can click the name of a tenant to go to its Overview page. For more information, see Overview.
You can hover the pointer over the tag indicating the primary/standby status of a tenant and view its primary tenant or standby tenants in the pop-up window. You can click Topology of Primary/Standby Tenants to go to the topology page and view details about the primary tenant or standby tenants of the current tenant. For more information, see View the topology of primary/standby relationships of a tenant.
You can hover the pointer over the tag of a tenant to view all its tags. You can click the Edit icon to manage the tags. For more information, see Manage tags.
You can click the Copy icon next to the name of a tenant to copy its name.
You can sort tenants by the Cluster column. In addition, you can click the name of a cluster to go to the tenant management page of the cluster. For more information, see Overview of the Cluster Details page.
When a tenant is in the Maintaining state, you can click View Task in the Actions column to go to the task details page of the tenant. On the task details page, you can perform operations such as viewing task logs, rolling back a task, and retrying a task. For more information, see Manage tasks.
Parameter |
Description |
|---|---|
| Tag | A tag that is set based on the content and attributes of the tenant. |
| Mode | The mode of the tenant, which may be Oracle or MySQL. You can filter tenants by mode. |
| Primary Zone | The priorities of zones of the tenant. |
| Status | The status of the cluster. Valid values include Running, Creating, Maintaining, Deleting, and Unavailable. |
| Created At | The time when the tenant was created. You can sort tenants by creation time. |
| Actions | You can perform operations on the tenant by clicking Lock, Copy, View Task, and Delete. Note |
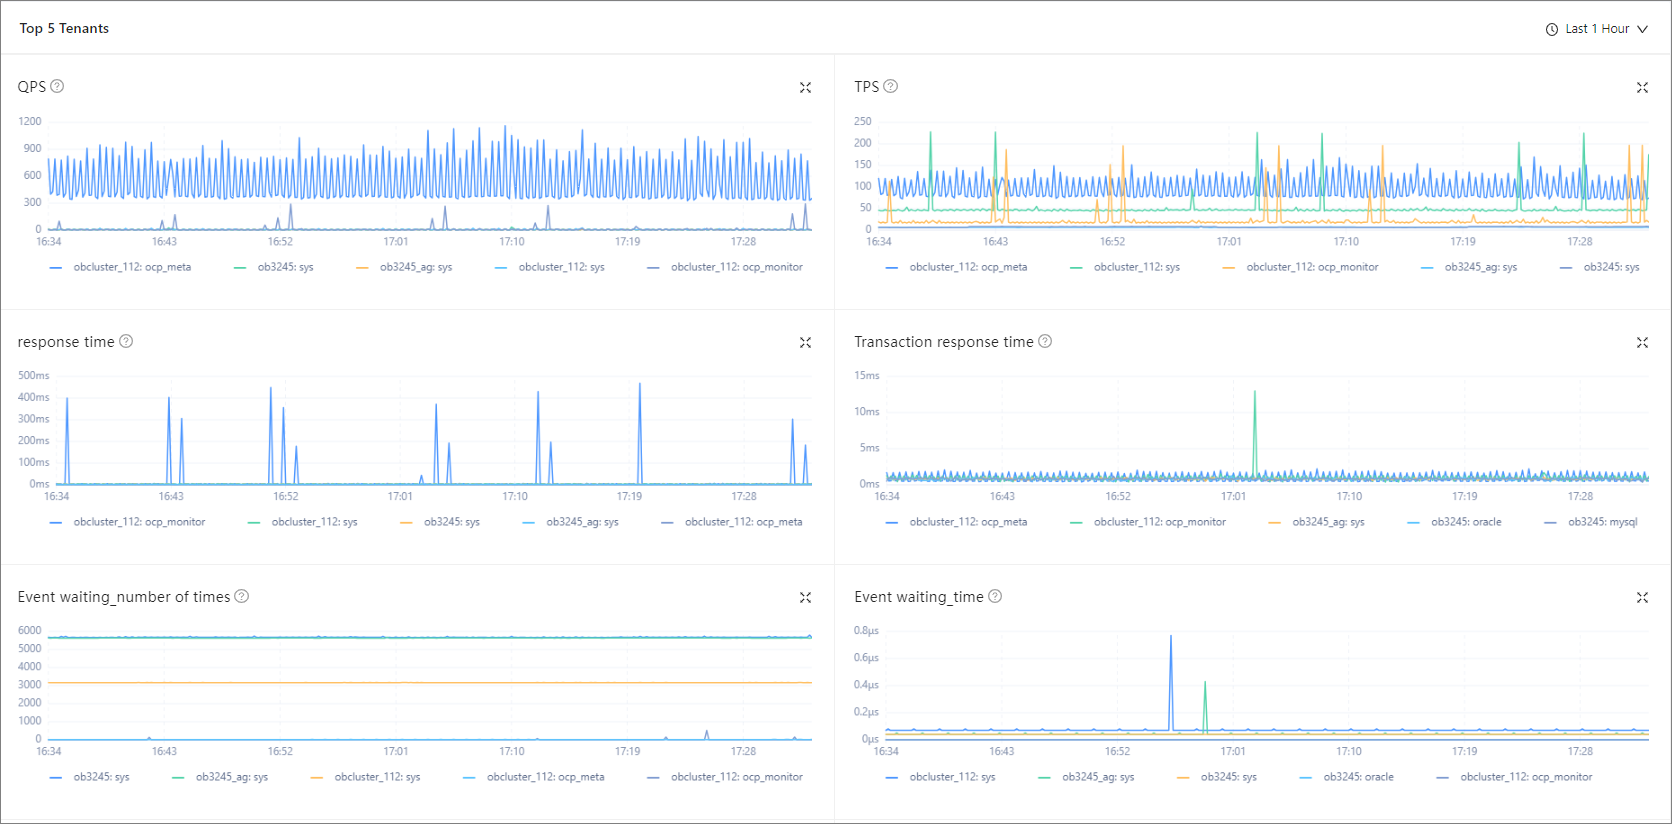
Top 5 tenants
In this section, you can view the following monitoring data of tenants in the last hour, 24 hours, or 7 days: QPS, TPS, SQL response time, Transaction response time, Sessions, Event waiting_Number of times, Event waiting_Time, and Capacity_Number of tables.
You can click the zoom-in icon in the upper-right corner to zoom in the chart or select a monitoring time range.
Metric |
Description |
|---|---|
| QPS | The average number of SQL statements processed per second. |
| TPS | The average number of transactions processed per second. |
| Response Time | The SQL response time, in µs. |
| Transaction Response Time | The average amount of time taken by the server to process a transaction, in µs. |
| Sessions | The current number of sessions and the current number of active sessions. Data source: __all_virtual_processlist. |
| Event waiting_Number of times | The average number of wait events per second. |
| Event waiting_Time | The average wait time of each wait event, in μs. |
| Capacity_Number of tables | The number of tables. |