The Overview page of OceanBase Cloud Platform (OCP) shows information about various resources managed in OCP, such as OceanBase clusters, OceanBase Database tenants, OBProxy clusters, and hosts. You can view the alerts, diagnostics, and usage of the resources for quick troubleshooting.
Note
Only users with the ADMIN role are allowed to access the Overview page.
Basic resource information
You can view the runtime status of OceanBase clusters, OceanBase Database tenants, OBProxy clusters, and hosts, and perform prompt O&M management on abnormal resources.
You can move the pointer over the question mark (?) next to OceanBase Cluster and view the statistics of CPU cores deployed for the cluster.

Task and diagnostic information
You can view task and diagnostic information.
- Task information: You can view the status and level of alerts, backup tasks, O&M tasks, and the information about the five most time-consuming major compaction tasks in the last seven days.
- Diagnostic information:
- SQL Diagnostics: This section displays the number of clusters with suspicious, slow, and new SQL statements in the last 6 hours.
- Transaction Diagnostics: This section displays the number of clusters with long-running and suspended transactions in real time.
- Session Diagnostics: This section displays the number of clusters with deadlocks in the last seven days.
- Security Diagnostics: This section displays the number of clusters with high-risk SQL statements in the last seven days.
- Optimization History: This section displays the number of clusters that were optimized in the last seven days.

Top 5 clusters ranked by allocated resources
You can view information about the top five OceanBase clusters ranked by CPU allocation rate, memory allocation rate, or disk usage. For more information about each metric, see Overview of metrics.

Top 5 tenants ranked by resource usage
You can view information about the top five OceanBase Database tenants ranked by CPU utilization, memory usage, and data volume (GB). For more information, see Overview of metrics.

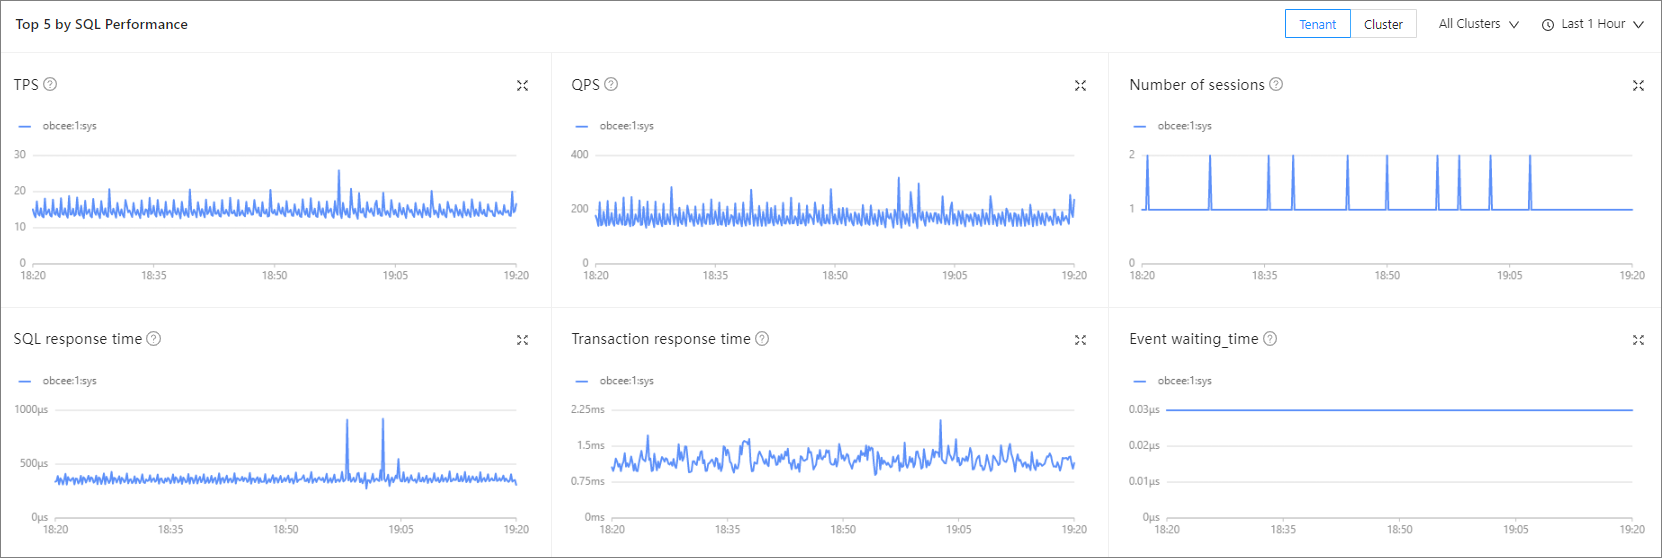
Top 5 SQL statements ranked by performance metrics
You can specify different periods to view information about the top five OceanBase clusters or OceanBase Database tenants ranked by monitoring metrics, such as QPS, TPS, SQL response time, number of sessions, transaction response time, and event wait time. For more information, see Overview of metrics.

Top 5 OBProxy clusters ranked by performance metrics
You can view information about the top five OBProxy clusters ranked by the number of client connections, QPS, and SQL response time. For more information, see Overview of metrics.

Top 5 hosts ranked by performance metrics
You can specify different periods to view information about the top five hosts ranked by monitoring metrics, such as CPU utilization, I/O duration, network throughput, and memory usage. For more information, see Overview of metrics.


