After you create a dashboard, you can add charts of concern to the dashboard.
Prerequisites
- You have the
PROFILEprivilege. - Dashboards created by different users are mutually isolated. You can view and manage only your own monitoring dashboards.
- You can add at most 32 monitoring charts to each dashboard.
- You have the read-only privilege on monitoring objects.
Add a chart
OceanBase Cloud Platform (OCP) allows you to add a chart by using the following methods:
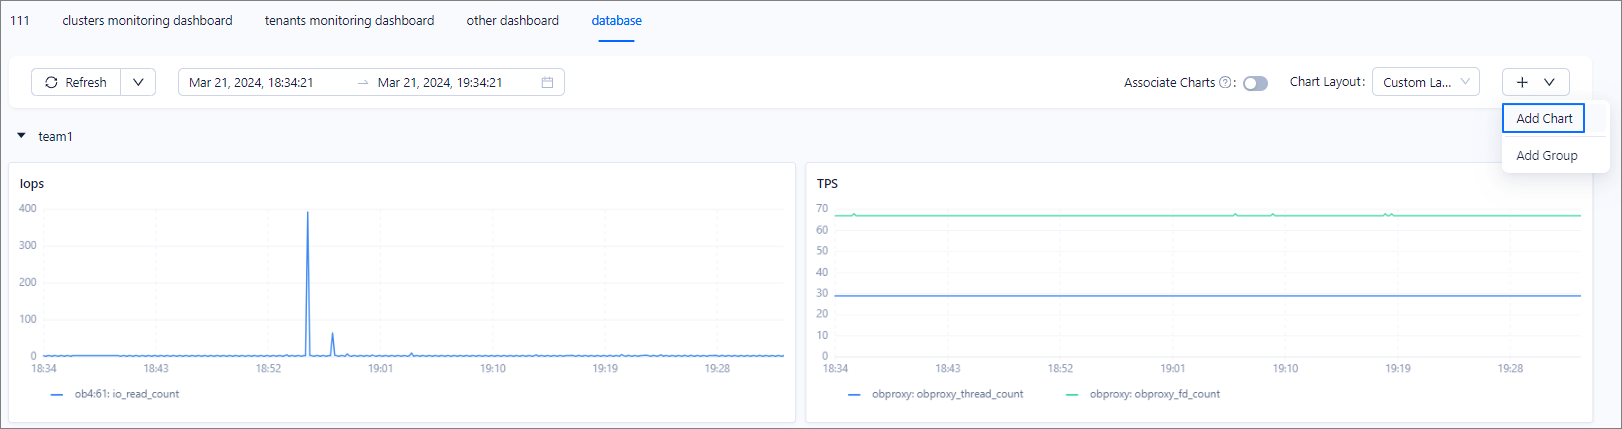
- Method 1: Click the
 icon on the tab of a dashboard and select Add Chart from the drop-down list.
 - Method 2: On the tab of a dashboard without charts, click Add Chart to add one.
- Method 3: On the tab of a dashboard, select a group, click the
 icon, and select Add Chart from the drop-down list.
The procedure of Method 1 is described as follows:
Log in to the OCP console.
In the left-side navigation pane, select Monitoring Dashboards.
Go to the tab of the dashboard for which charts are to be added. Click the Add icon and select Add Chart from the drop-down list.
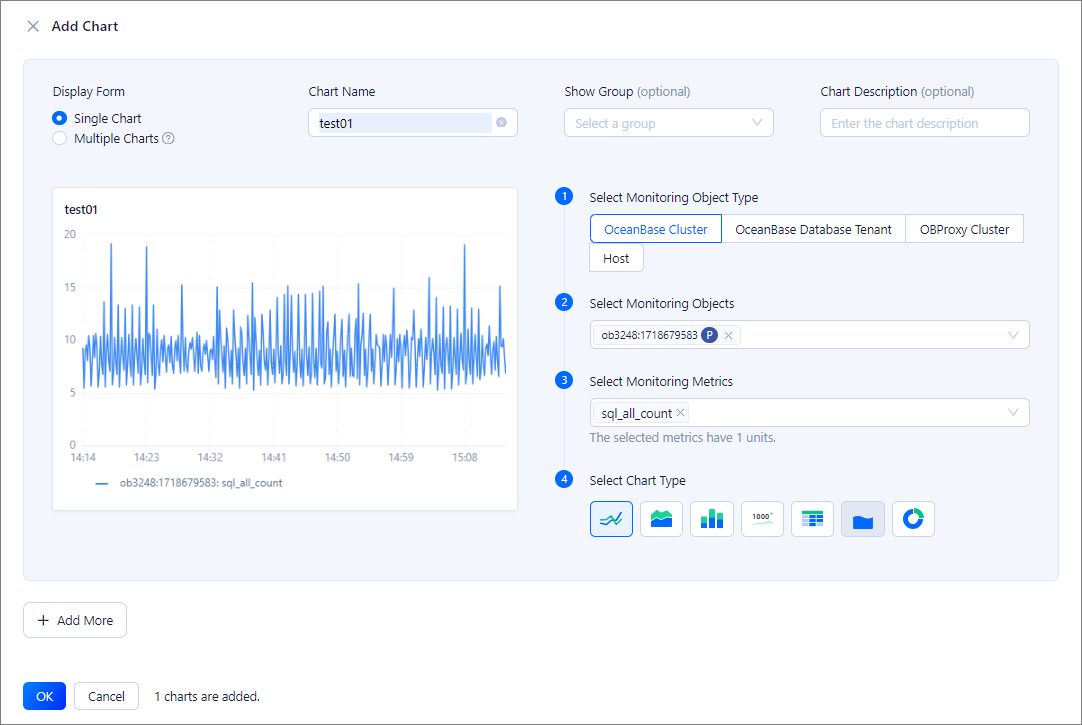
In the panel that appears, specify relevant information and click OK.
The following table describes the parameters.
ParameterDescriptionDisplay Form The display mode of charts. Valid values: Single Chart and Multiple Charts. - Single Chart: In this mode, you can add a single chart for the following scenarios: a single metric of a single object, multiple metrics of a single object, a single metric of multiple objects, and multiple metrics of multiple objects.
- Multiple Charts: In this mode, you can batch add multiple single-object single-metric charts. If you select multiple monitoring objects or metrics, the system automatically generates chart names in the "object: metric" format and the description, and displays multiple single-object single-metric charts.
For example, in multi-chart mode, if you select thecluster01andcluster02clusters as the monitoring objects, andsql_all_countandsql_select_countas the monitoring metrics, the system generates the following four single-object single-metric charts:cluster01: sql_all_count,cluster02: sql_select_count,cluster02: sql_select_count, andcluster02: sql_select_count.
Chart Name The unique identifier of the monitoring chart in the dashboard. It must be 2 to 32 characters in length. Show Group Optional. The group to which the monitoring chart belongs. Charts in the same group are displayed in the same module. - You can click Add Group to add a group.
- When you add a chart in a specific group, this parameter is unavailable.
Chart Description Optional. The description of the monitoring chart to be added. Select monitoring objects and metrics Perform the following steps: - Select Monitoring Object Type: Select OceanBase Cluster, OceanBase Database Tenant, OBProxy Cluster, or Host.
- Select Monitoring Objects: Select monitoring objects of the specified type from the drop-down list.
- Select Monitoring Metrics: Select monitoring metrics for the specified monitoring objects from the drop-down list.
- If a required metric exists in the drop-down list, directly select it. Otherwise, you can click Add Metric at the bottom of the drop-down list to add one. For more information, see Create a metric.
- The monitoring metrics displayed in the drop-down list include built-in metrics of OCP and user-defined metrics. For more information about built-in metrics of OCP, see Overview of metrics.
Notice
At most two types of units are allowed for the selected metrics.
- Select Chart Type: At present, the following types of charts are supported:
- Trend charts: line charts, area charts, and bar charts.
- Display charts: statistical metric cards and tables.
- Percentage charts: liquid fill charts and doughnut charts.
By default, the system adds only one chart. To add multiple charts at a time, click Add More in the lower part.
Related operations
You can perform the following O&M operations on charts in a dashboard:
Move a chart: You can drag a chart to adjust its position in the dashboard.
View details of a chart: You can hover the pointer over a point in time in a trend chart to view the detailed data at this point in time. If you drag to select an area in the chart, the system will zoom in on the trend information of this area. You can view the detailed trend of this metric within this period. You can double-click the trend chart so that it resumes normal.
Hide a legend: You can click a legend in the lower part of a trend chart to hide the legend. Then, the trend chart no longer displays the data of this legend. You can hide multiple legends.
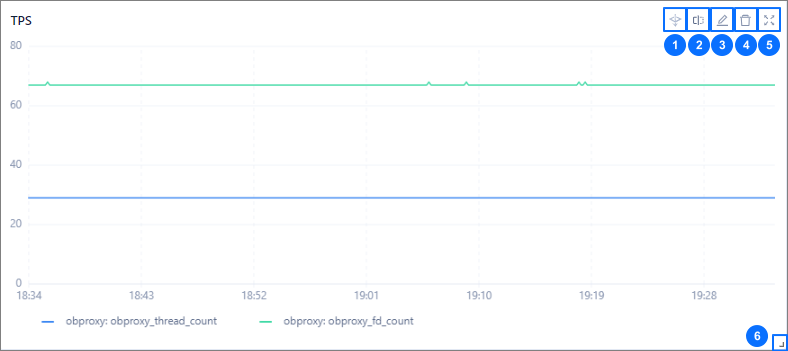
Perform drill-down analysis: You can click the Drill-down Analysis icon (as indicated by ① in the following figure) to view the monitoring data of different dimensions. When you notice an exception in the monitoring data of a monitoring object, you can drill down to the server where the exception occurs.
Note
Drill-down analysis is supported only for the line chart of a single OceanBase cluster or tenant.
Compare monitoring data: You can click the Compare icon (as indicated by ② in the following figure) to view the period-on-period, day-on-day, week-on-week, and month-on-month comparison data within the specified period.
Edit a chart: You can click the Edit icon (as indicated by ③ in the following figure) to edit the chart.
Delete a chart: You can click the Delete icon (as indicated by ④ in the following figure) to delete the chart from the dashboard.
Zoom in on a trend chart: You can click the Zoom in icon (as indicated by ⑤ in the following figure) to zoom in on a trend chart. You can also view details and hide metrics in a zoomed-in chart.
Resize a chart: You can click the Resize icon (as indicated by ⑥ in the following figure) to resize the chart. You can perform all preceding operations in a resized trend chart.