


In database operations and maintenance scenarios, high CPU usage or uneven CPU usage is very common. The causes in this scenario can be broadly categorized into the following two directions:
The first is CPU abnormalities caused by cluster environment issues. For example, network interface card interrupts, disk failures, driver failures, or third-party services (such as security services) may cause other processes to preempt part of the CPU resources on the node where the OBServer resides, resulting in abnormal CPU usage shown in monitoring.
The second is that the observer process itself occupies excessive CPU resources. For example, for SQL execution, remote execution, background threads, or RPC execution.
When identifying a scenario with CPU abnormalities, you must first use Linux system monitoring tools, such as tsar, to rule out the first type of issue. This topic focuses on locating the second type of issue, that is, troubleshooting why the observer process occupies a large amount of CPU resources.
Before troubleshooting high or uneven CPU usage, let's first introduce the general troubleshooting approach and common causes.
By examining the frontend and backend loads in the ASH Report, identify the root cause in the following scenarios:
The tenant's leader node receives more internal RPC/inner SQL requests, forming a CPU hotspot.
Troubleshooting approach: Check the backend load in the ASH Report to determine how internal RPC/inner SQL is generated, and analyze it in relation to the SQL dimension.
Inappropriate concurrency settings for PX parallel execution lead to CPU spikes.
Troubleshooting approach: In the ASH Report, you will see that most database tasks are related to PX parallel execution. Analyze them in relation to the SQL dimension and adjust the concurrency.
A series of background tasks, represented by minor compactions, consume excessive CPU resources.
Troubleshooting approach: Check the backend load in the ASH Report to determine how internal RPC/inner SQL is generated, and analyze it in relation to the SQL dimension.
Internal retry events in OceanBase Database consume excessive CPU resources.
Troubleshooting approach: Check the retry-type waiting events in the ASH Report and analyze them in relation to the SQL dimension.
Drill down through the ASH Report to identify the root cause in the following scenarios:
ODP routing errors cause SQL traffic to concentrate on one node.
Troubleshooting approach: Check the frontend and backend loads in the ASH Report to see if the frontend load is concentrated on one node or if there are many events with
Actionset toOB_REMOTE_SYNC_EXECUTEin the backend load. Then, based on thepartition_hitcolumns inGV$OB_SQL_AUDIT, check whether the ODP routing hit its target.Uneven table structure distribution leads to uneven SQL pressure.
Troubleshooting approach: After checking the frontend and backend loads to identify hot nodes, tenants, etc., then check the tablet_id access patterns in the ASH Report data to find the tablet_id with the highest access count and perform balancing.
Frequent-use accounts cause user SQL to be hot in certain partitions.
Troubleshooting approach: Analyze the partition data corresponding to the frequently-used accounts and plan data distribution appropriately.
The flowchart for troubleshooting uneven CPU usage is shown below.
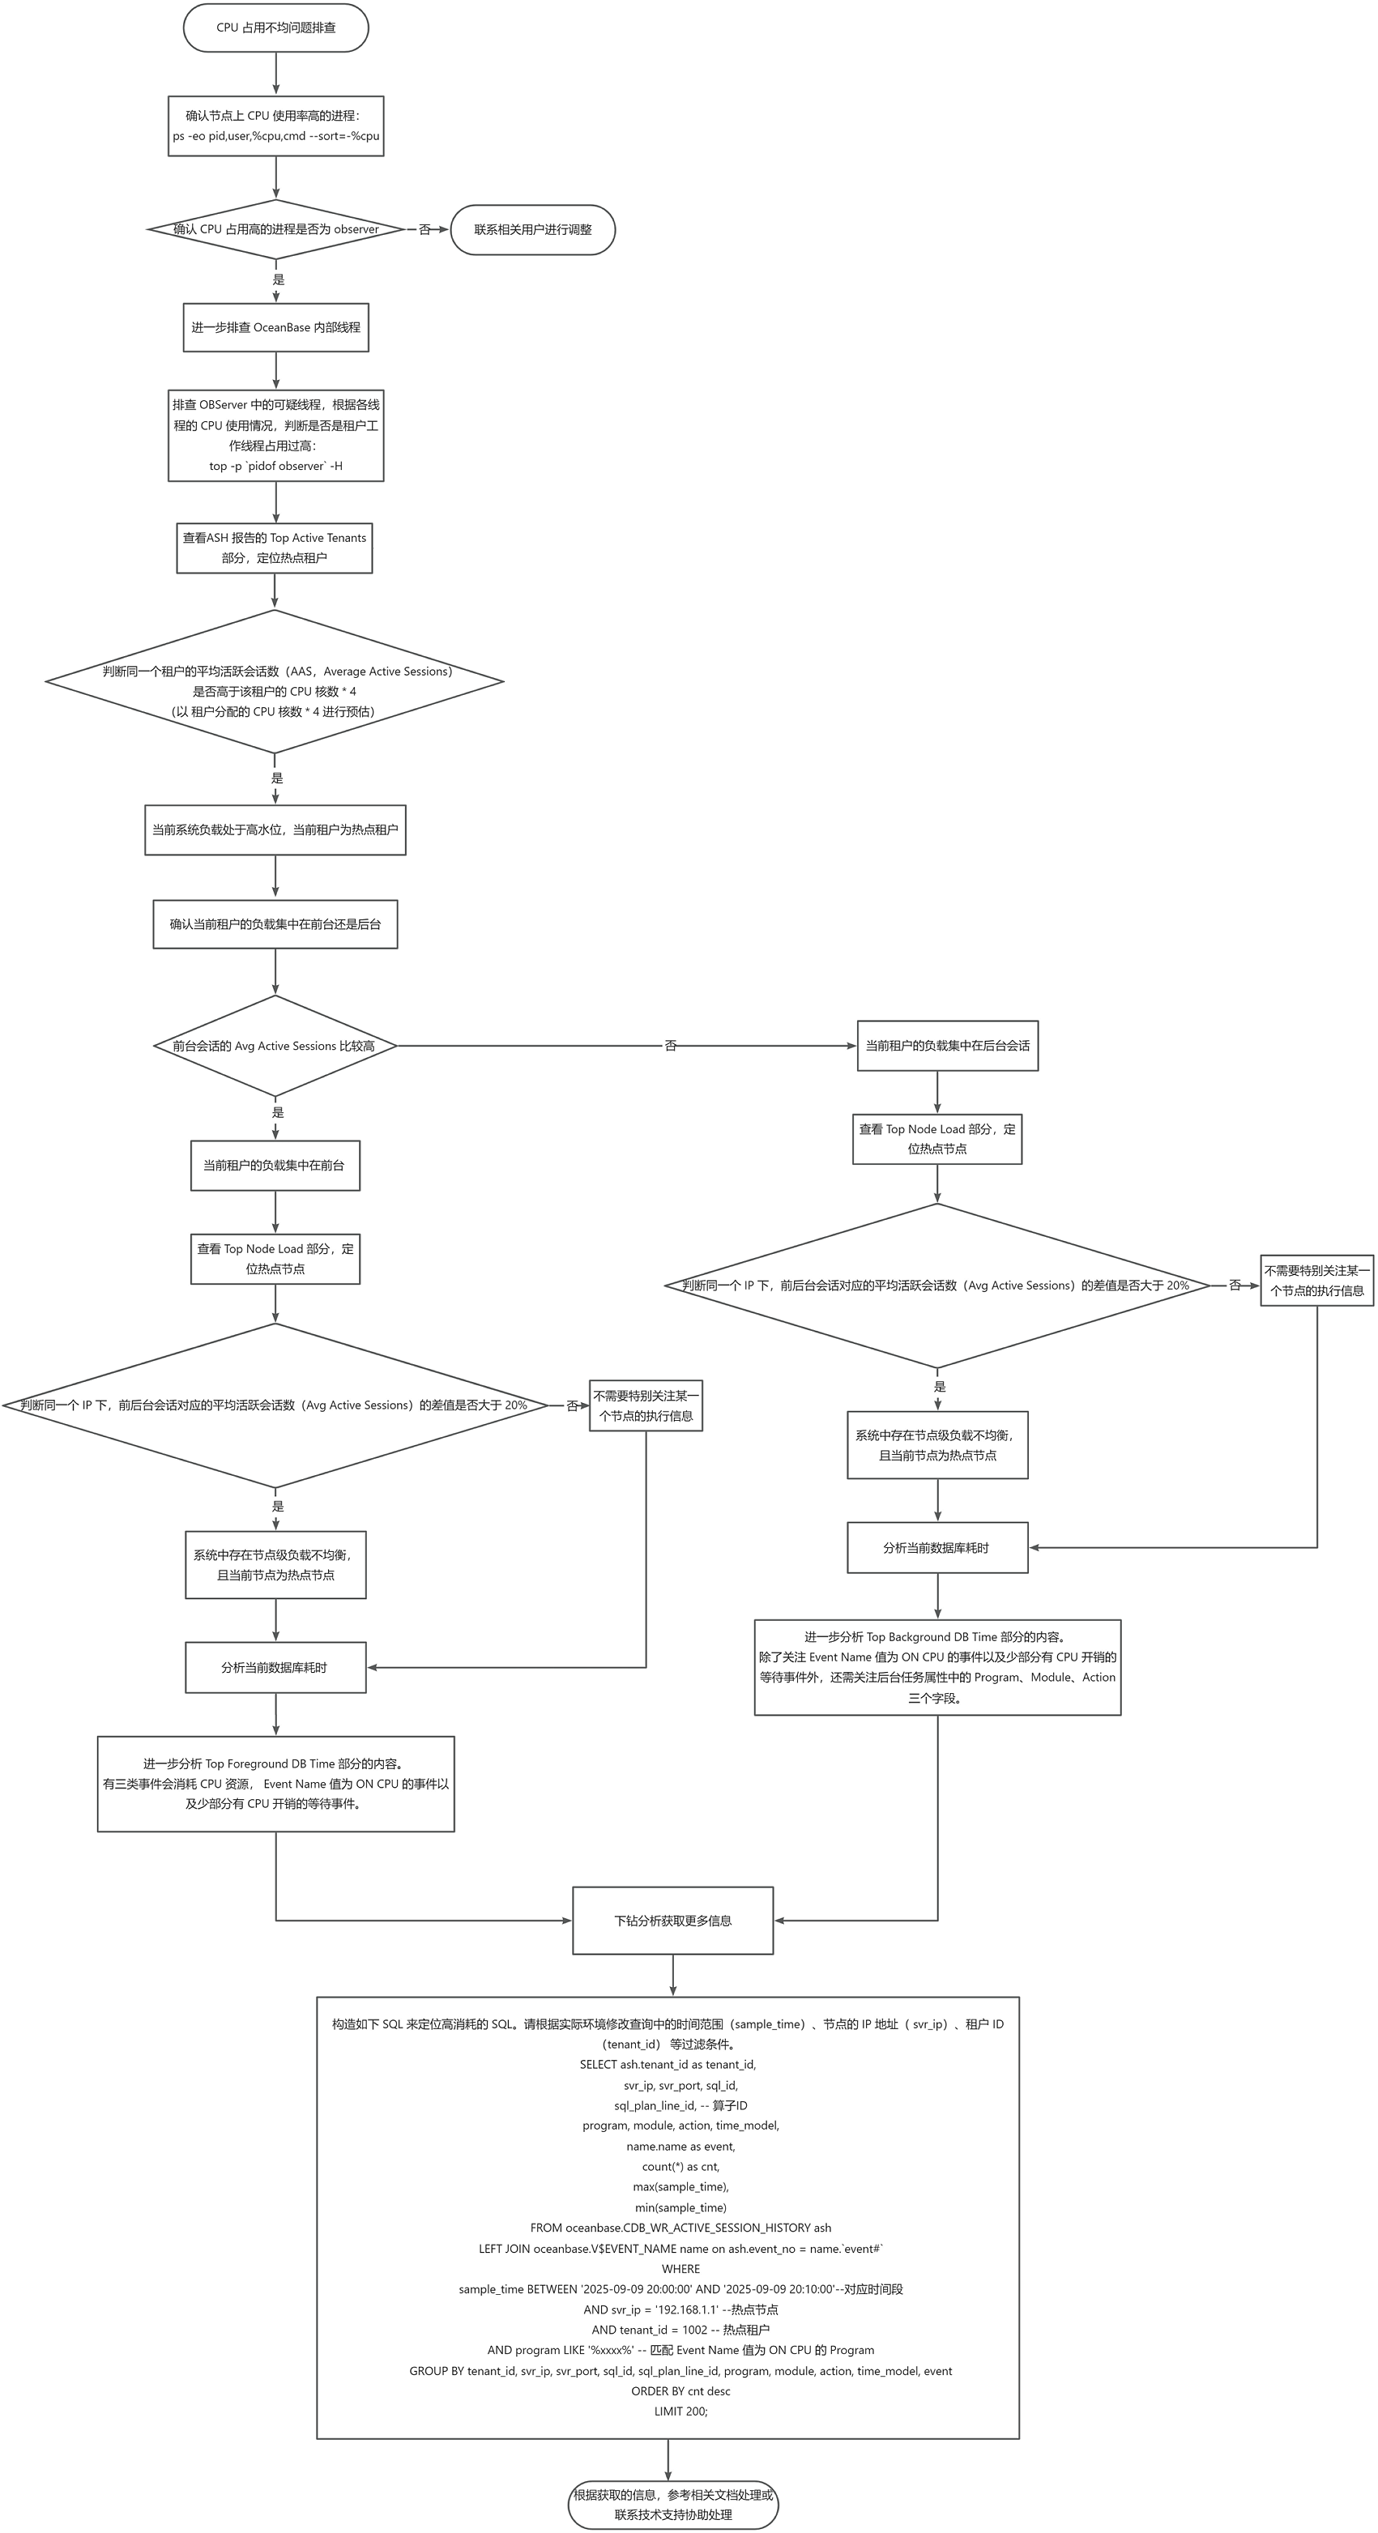
Procedure
Step 1: Confirm that the process with high CPU usage on the node is the observer process
Before troubleshooting, confirm whether the process with high CPU usage on the specified node is the observer process using the following statement.
ps -eo pid,user,%cpu,cmd --sort=-%cpu
A sample output is as follows:
PID USER %CPU CMD
124648 user_a 99.9 other_process
1332 user_b 50.5 observer
Based on the return result:
If the process with high CPU usage is the observer, further troubleshooting of internal OceanBase threads is required.
If it is another process (such as other_process), contact the relevant user for adjustment.
Step 2: Troubleshoot internal OceanBase threads
Troubleshoot suspicious threads in the OBServer.
If the observer process occupies a high amount of CPU, you can use the following command to view its thread status:
top -p `pidof observer` -HThis command displays the CPU usage of each thread in the observer process, helping you determine if tenant worker threads are consuming too much resources.
Analyze the ASH Report for overall load and identify hot tenants.
Check the Top Active Tenants section of the ASH Report to locate hot tenants based on the information provided.
Determine whether the average active sessions (
Average Active Sessions) for the same tenant is higher than the tenant'sCPU cores * 4(estimated asCPU cores allocated to the tenant * 4):If
Average Active Sessionsis high, it indicates the current system load is at a high level, and the tenant is a hot tenant.Then, determine whether the tenant's load is concentrated in the foreground or background.
If the
Avg Active Sessionsfor foreground sessions is relatively high, it means the tenant's load is concentrated in foreground sessions.If the
Avg Active Sessionsfor background sessions is relatively high, it means the tenant's load is concentrated in background sessions.
Identify hot nodes.
Check the Top Node Load section of the ASH Report. Determine whether the difference in average active sessions (Avg Active Sessions) between foreground and background sessions under the same IP address exceeds 20% to identify if the current node is a hot node.
If so, it indicates there is node-level load imbalance in the system.
If not, no special attention is needed for the execution information of any particular node.
Analyze database time consumption.
After identifying hot tenants or hot nodes, you can analyze the current database time consumption.
If the load is concentrated in foreground sessions, further analysis of the Top Foreground DB Time section is required.
For foreground sessions, three types of events consume CPU resources: events with an
Event Namevalue ofON CPU, and a small number of CPU-intensive wait events. Specifically:ON CPU: The database considers the current session to be consuming CPU resources to process tasks.Wait events:
Wait events starting with
retry: indicate that some type of retry is in progress within OceanBase Database. The internal retry mechanism of OceanBase Database consumes some CPU resources.exec inner sql wait: indicates the result return of an SQL accessing an internal table issued during execution, such as obtaining user table locations or schema information. This process also consumes some CPU resources.
If the load is concentrated in background sessions, further analysis of the Top Background DB Time section is required.
For background sessions, in addition to paying attention to the three types of events mentioned for foreground sessions, you also need to consider the properties of background tasks. The
Program,Module, andActionfields label the properties of background tasks:If the value corresponding to the
Actionfield isOB_DAS.Async_ACCESS, it indicates the background task is for SQL remote DAS execution.If the value corresponding to the
Programfield is similar toxxx_PxPool, it indicates the background task is for PX parallel execution.If the value corresponding to the
Programfield is similar toxxx_DAG, it indicates the background task is a minor compaction or major compaction task.If the value corresponding to the
Programfield is similar toxxx_RPC_REQUEST, it indicates the background task is an RPC task sent internally within the OBServer node.
Note
The above are common types of background tasks. In addition, there are hundreds of other types of background tasks.
After the preceding analysis, you can already identify the nodes, tenants, and specific task types where CPU overhead is primarily concentrated, essentially confirming where the main CPU overhead lies in the database system. Generally, the troubleshooting steps above help us locate the general direction of the problem and potential bottleneck points. However, in some scenarios, we still wish to drill down further to obtain more information.
Based on the previous analysis, if the background task overhead is mainly in PX or DAS execution, you need to know what the corresponding sql_id is. You can construct the following SQL query to find it.
Note
Modify the filter conditions in the query based on your actual environment, such as the time range (
sample_time), node IP address (svr_ip), and tenant ID (tenant_id).obclient(root@sys)[oceanbase]> SELECT ash.tenant_id as tenant_id, svr_ip, svr_port, sql_id, sql_plan_line_id, -- Operator ID program, module, action, time_model, name.name as event, count(*) as cnt, max(sample_time), min(sample_time) FROM oceanbase.CDB_WR_ACTIVE_SESSION_HISTORY ash LEFT JOIN oceanbase.V$EVENT_NAME name on ash.event_no = name.`event#` WHERE sample_time BETWEEN '2025-09-09 20:00:00' AND '2025-09-09 20:10:00'--Corresponding time period AND svr_ip = '192.168.1.1' -- Hot node AND tenant_id = 1002 -- Hot tenant AND program LIKE '%xxxx%' -- Matches the Program where the Event Name value is ON CPU GROUP BY tenant_id, svr_ip, svr_port, sql_id, sql_plan_line_id, program, module, action, time_model, event ORDER BY cnt desc LIMIT 200;The following examples illustrate this.
Example 1:
*_SQL_CMDindicates that the user SQL requests in the current database consume excessive CPU resources. The root cause may be uneven data distribution, ODP routing errors, etc.You can use the following SQL statement to locate high-consumption SQL statements.
obclient(root@sys)[oceanbase]> SELECT ash.tenant_id as tenant_id, svr_ip, svr_port, sql_id, sql_plan_line_id, -- Operator ID program, module, action, time_model, name.name as event, count(*) as cnt, max(sample_time), min(sample_time) FROM oceanbase.CDB_WR_ACTIVE_SESSION_HISTORY ash LEFT JOIN oceanbase.V$EVENT_NAME name on ash.event_no = name.`event#` WHERE sample_time BETWEEN '2025-09-09 20:00:00' AND '2025-09-09 20:10:00' AND svr_ip = '192.168.1.1' AND tenant_id = 1002 AND program LIKE '%_SQL_CMD%' -- Filters user SQL requests GROUP BY tenant_id, svr_ip, svr_port, sql_id, sql_plan_line_id, program, module, action, time_model, event ORDER BY cnt desc LIMIT 200;Example 2:
*_RPC_PROCESS*indicates that processing RPC requests consumes excessive CPU resources. The root cause may be a series of background tasks, such as minor compactions, consuming too much CPU; the tenant's leader node will receive more internal RPC/inner SQL requests.You can use the following SQL statement to locate high-consumption SQL statements.
obclient(root@sys)[oceanbase]> SELECT ash.tenant_id as tenant_id, svr_ip, svr_port, sql_id, program, module, action, time_model, name.name as event, count(*) as cnt, max(sample_time), min(sample_time) FROM oceanbase.CDB_WR_ACTIVE_SESSION_HISTORY ash LEFT JOIN oceanbase.V$EVENT_NAME name on ash.event_no = name.`event#` WHERE sample_time BETWEEN '2025-09-09 20:00:00' AND '2025-09-09 20:10:00' AND svr_ip = '192.168.1.100' AND tenant_id = 1 AND (program LIKE '%_RPC_PROCESS%') GROUP BY tenant_id, svr_ip, svr_port, sql_id, program, module, action, time_model, event ORDER BY cnt desc LIMIT 200;Example 3:
*PX*or*_DAS_*indicates that remote execution consumes excessive CPU resources. The root cause may be an inappropriate concurrency setting for PX parallel execution.You can use the following SQL statement to locate high-consumption SQL statements.
obclient(root@sys)[oceanbase]> SELECT ash.tenant_id as tenant_id, svr_ip, svr_port, sql_id, program, module, action, time_model, name.name as event, count(*) as cnt, max(sample_time), min(sample_time) FROM oceanbase.CDB_WR_ACTIVE_SESSION_HISTORY ash LEFT JOIN oceanbase.V$EVENT_NAME name on ash.event_no = name.`event#` WHERE sample_time BETWEEN '2025-09-09 20:00:00' AND '2025-09-09 20:10:00' AND svr_ip = '192.168.1.1' AND tenant_id = 1002 AND (IN_PX_EXECUTION = 'Y' or IN_REMOTE_DAS_EXECUTION = 'Y') GROUP BY tenant_id, svr_ip, svr_port, sql_id, program, module, action, time_model, event ORDER BY cnt desc LIMIT 200;
Based on the information obtained, refer to the relevant documentation for handling the issue or contact technical support for assistance.