OceanBase Cloud Platform (OCP) allows you to view transaction performance monitoring data by using the following methods:
Method 1:
Log in to the OCP console and go to the Overview page of the target tenant. In the left-side navigation pane, click Performance Monitoring.
Method 2:
Log in to the OCP console. In the left-side navigation pane, click Performance Monitoring to go to the OceanBase Database Tenant tab.
Prerequisites
You have the read-only privilege on the target tenant.
Procedure
The procedure of Method 2 is described as follows:
Log in to the OCP console.
In the left-side navigation pane, click Performance Monitoring.
Click the OceanBase Database Tenant tab.
In the Data Filtering section, configure the parameters for filtering monitoring data.
The following table describes the filter parameters.
Parameter Description Cluster This parameter is not displayed in auto-refresh mode. Select a cluster to view its monitoring information. Zone By default, the monitoring information of all zones is displayed. OBServer By default, the monitoring information of all OBServer nodes is displayed. Select Time This parameter is not displayed in auto-refresh mode. Select the time range of the data that you want to query. Auto Refresh By default, the auto-refresh mode is disabled. After it is enabled, performance monitoring data is refreshed every 5 seconds. 
Click the Transaction tab and view the transaction monitoring data of tenants.
OCP allows you to view monitoring data in two dimensions: tenant and unit. By default, the system displays the monitoring data in the tenant dimension. The metrics vary in different dimensions.
By default, the system displays all metrics in the current dimension. If you want to ignore a metric, click Select Metric on the right of the area and deselect the metric in the panel that appears.
For more information about the monitoring metrics, see Overview of metrics. If the statistical range covers multiple OBServer nodes, the aggregate metric values of the OBServer nodes are displayed.
Note
- The Transaction response time metric applies to OceanBase Database V3.2.4.1 and later, except V4.0.0.0.
- The Transaction table read request hits metric applies to OceanBase Database V4.2.0 and later.
- The XA trans count, XA trans statement count and XA trans statement rt metrics apply to OceanBase Database V4.2.2 and later.
- The Partitions metric applies to OceanBase Database of a version earlier than V4.0.0.0.
The following features allow you to view and analyze the performance monitoring data on a trend chart in a more efficient manner. You can learn about the features with the help of the figure below.

Filter data.
View the trend details of a metric over a specific period of time: To use this feature, drag the pointer over a period of time to select this period. The system will then zoom in to display the trend details. To resume to the normal view, double-click the trend chart, as indicated by ① in the preceding figure.
Hide the data of a submetric: To use this feature, click the icon of this submetric. The submetric will then turn gray and its data will be hidden from the chart, as indicated by ② in the preceding figure.
View the detailed data of a specific point in time: To use this feature, hover the pointer over a point in time on the trend chart, as indicated by ③ in the preceding figure.
Zoom in on a trend chart: To use this feature, click the zoom-in icon in the upper-right corner of the chart. The features indicated by ①, ②, and ③ in the preceding figure are also applicable to a zoomed-in chart.
Drill down to view monitoring data in different dimensions: If you find an abnormal metric such as a long transaction response time on the Tenant Dimension tab, perform drill-down analysis to identify the faulty server. Click the Drill-down Analysis icon in the upper-right corner of the trend chart to view the drill-down analysis details. The Transaction tab supports the following drill-down dimensions: tenant > OBServer node.
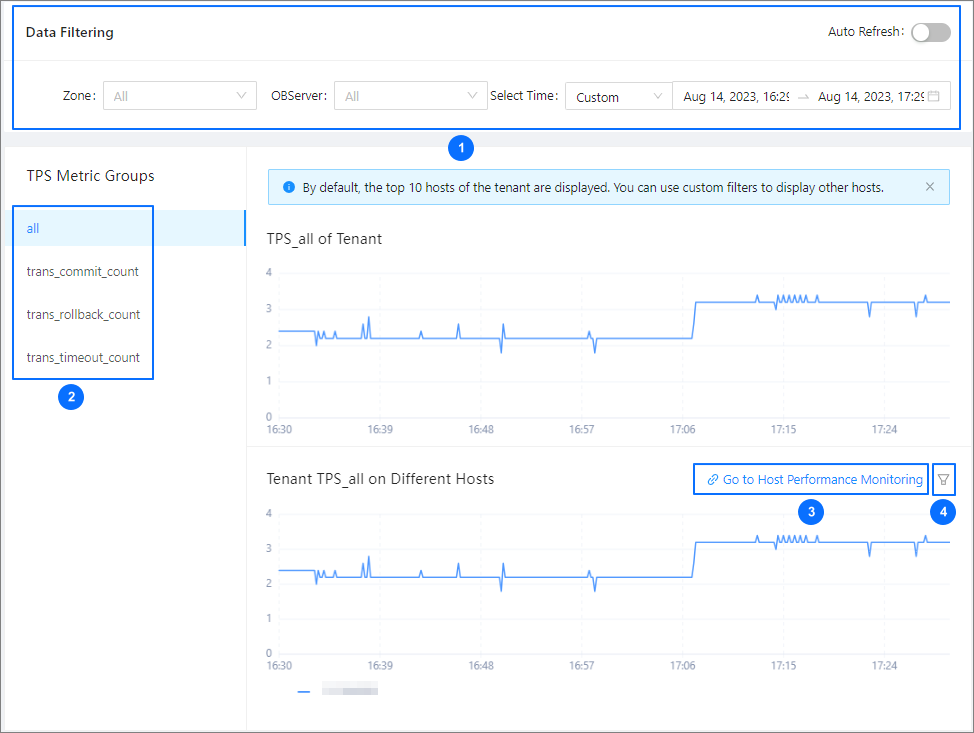
The features indicated by ①, ②, and ③ in the preceding figure are also applicable to a trend chart on a drill-down page. You can also perform the following operations:

In the Data Filtering section indicated by ① in the figure, specify filter conditions. If you do not specify any filter conditions, the drill-down page automatically inherits filter conditions from the upper-level page.
If the metric has submetrics, you can view the submetrics or drill down to other dimensions, as indicated by ② in the figure.
The trend chart also provides an entry to the host performance monitoring feature. Hover the pointer over the Go to Host Performance Monitoring link, as indicated by ③ in the figure, and click the target host to go to its Performance Monitoring page and view the monitoring details.
You can also click the icon indicated by ④ in the upper-right corner of a trend chart, and select the hosts whose performance monitoring data needs to be displayed on the trend chart.

