This topic describes how to use the capacity center.
Applicability
This topic applies only to OceanBase Cloud Platform (OCP) Enterprise Edition. OCP Community Edition does not support the capacity center feature.
Procedure
Log on to the OCP console.
In the left-side navigation pane, click OceanBase Autonomy Service.
In the Cluster Details section, click the name of the cluster that you want to view.
In the left-side navigation pane, click Capacity Center to view the related information as follows:
View the cluster capacity risks. The current capacity check items include the tenant CPU utilization, memory usage, disk usage, and number of connections.
Click View to go to the Resource Usage Tendency section and view the resource usage trends.

View the overall capacity usage information, including the allocated capacity and percentage of CPU, memory, and log disk resources, as well as the used capacity and percentage of data disk resources.

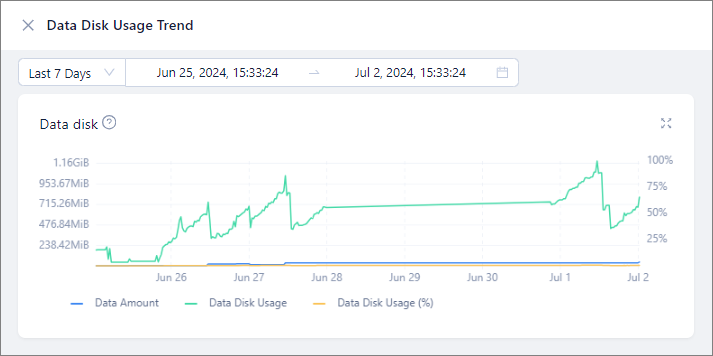
Click View Usage Trends in the Data Disk section. In the panel that appears, select a time range and view the data disk usage trends within the specified period.

View the resource usage details of tenants within the last 7 days, including the unit config, CPU, memory, and data disk usage details, and maximum number of connections of each tenant in the cluster.

View the capacity of tenants.
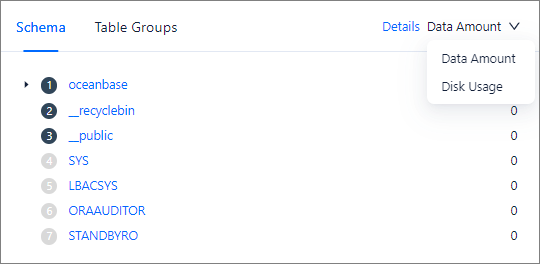
You can filter the capacity information by tenant, database, or table group.
You can view the usage trends of CPU, memory, log disk, and data disk resources over time.
You can view the trend charts of the last day, 7 days, 30 days, or a custom period no more than 60 days, to learn about the status of the current tenant, database, or table group. The trend charts of CPU, memory, and log disk resources are available only at the tenant level.
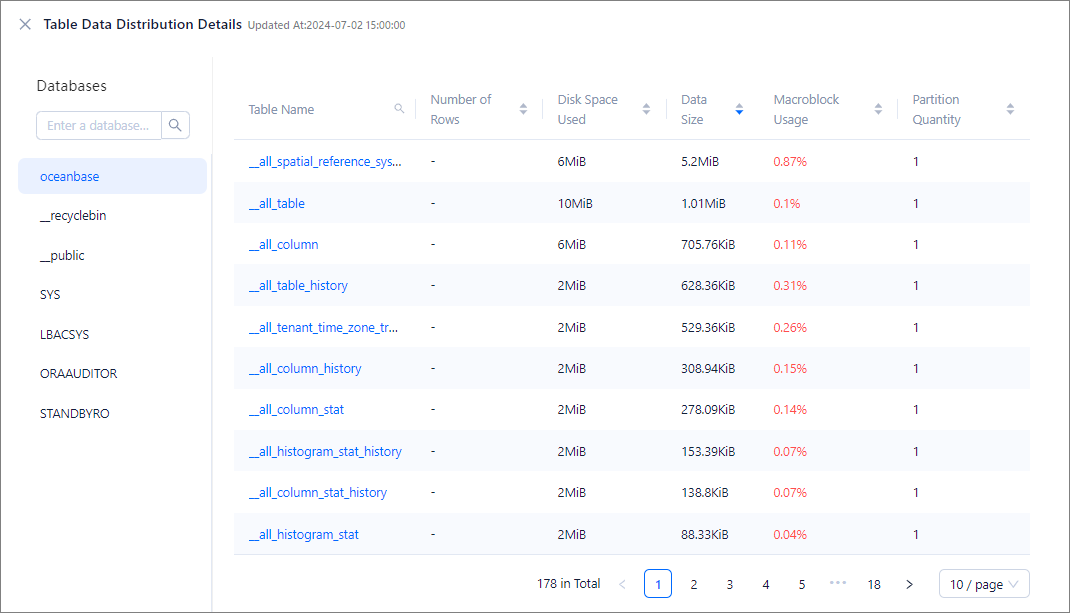
You can click the database name next to the Resource Usage Tendency section to view the details of all tables in the database, including the number of rows, size of occupied disk space, and size of data.

Click the name of a table to view its capacity usage trends.

You can sort databases, table groups, tables, and partitions by data size or disk usage.

Above the Resource Usage Tendency section, you can select Database next to Condition Range to filter the data by database. Select a database and then select a table in the ranking list. A panel showing all tables in the database appears, with the selected table highlighted.
For more information, see Manage the resources of a tenant.

