


The monitoring feature of OceanBase Database is dependent on the monitoring feature of OceanBase Cloud Platform (OCP). OCP supports 24/7 monitoring and collection of metrics such as the performance, capacity, and running status for clusters, tenants, and nodes and displays the metrics in graphics and tables, to help you fully understand the status of OceanBase clusters, identify cluster exceptions in a timely manner, and receive alerts in a timely manner, ensuring the stable and efficient operation of the database.
Monitoring
The monitoring feature of OceanBase Database covers the following parts:
Metric link (conventional monitoring metrics): OBServer node status monitoring, obproxy status monitoring, and host metrics monitoring.
OB SQL link: SQL and Plan metrics related to OceanBase Database.
OB resource usage link: collects resource usage of OceanBase clusters and tenants.
Metric monitoring
In metric monitoring, the following metrics are collected:
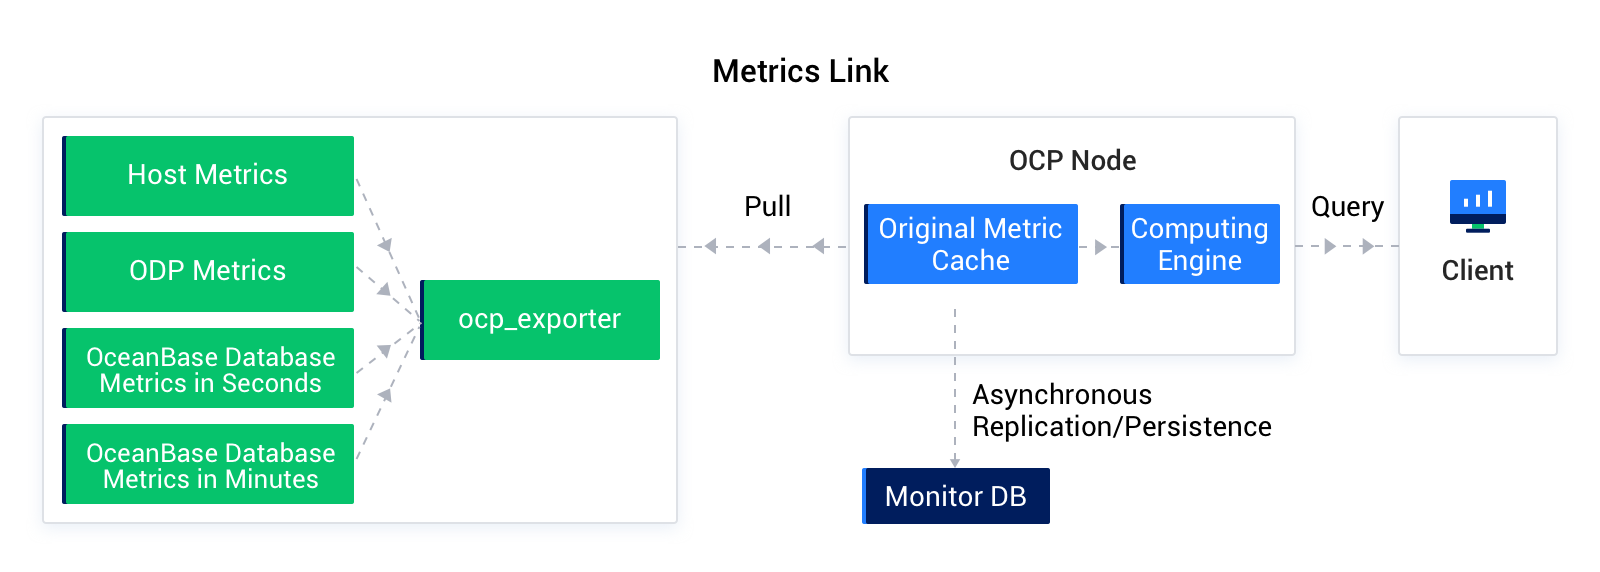
Host metrics: CPU, disk, I/O, load, and other information of the host and related services deployed on it (such as OBServer nodes and obproxy).
obproxy metrics: request, session, transaction, and other information related to obproxy.
OB second/minute-level metrics: resource status, QTPS, and other performance monitoring information of the corresponding OB nodes.
Metric monitoring depends on the ocp_exporter program of OCP-Agent on the host managed by OCP. The ocp_exporter program provides RESTful APIs to collect metrics in compliance with the Prometheus protocol and uses NodeExporter to collect the host metrics, OBProxyExporter to collect the ODP metrics, and OBCollector to collect the OBServer node metrics. OCP aggregates and converts the collected metrics, and saves them in MonitorDB. Then, the compute engine queries the metrics from MonitorDB by using the Prometheus-based expression, computes the monitoring data, and returns the results to the client. Then, the client displays the computing results in monitoring charts.
SQL monitoring
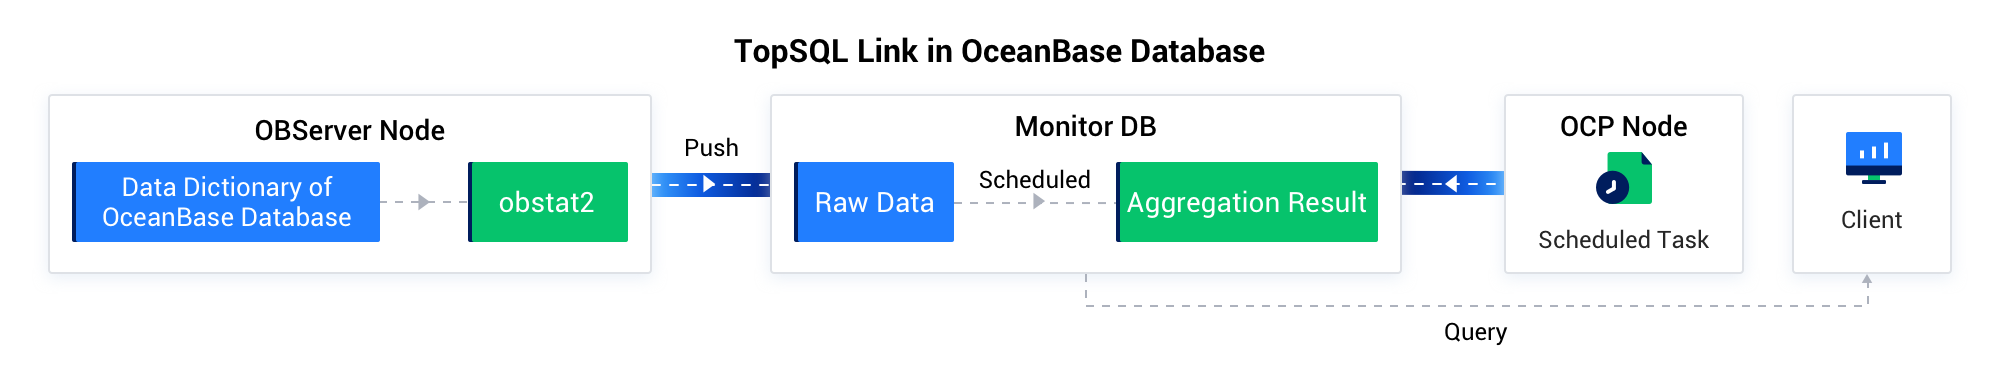
In SQL monitoring, metrics of SQL statements and SQL execution plans of each OceanBase cluster from the following views are collected:
v$sql_audit: records SQL execution audit information.v$plan_cache_plan_explain: records the information of each operator in the execution plan.v$plan_cache_plan_stat: records execution plan audit information.
Due to the huge amount of data of SQL statements and SQL execution plans, the obstat2 collection program is used to improve performance and reduce resource consumption. obstat2 is a high-performance and lightweight C++ program that can be configured based on the collection frequency. It collects the information of SQL statements and SQL execution plans from OceanBase views by the specified collection cycle, locally aggregates and computes the collected information, and saves it to OCP MonitorDB. OCP runs background tasks to periodically aggregate and compute the data saved in MonitorDB. The SQL audit and SQL plan data at the minimum monitoring interval are aggregated into the results of a longer monitoring interval and saved. You can query the monitoring data on the performance monitoring page of OCP. If you specify a short time interval, OCP queries the original reported tables. If you specify a long time interval, OCP queries the aggregated tables.
Resource monitoring link in OceanBase Database
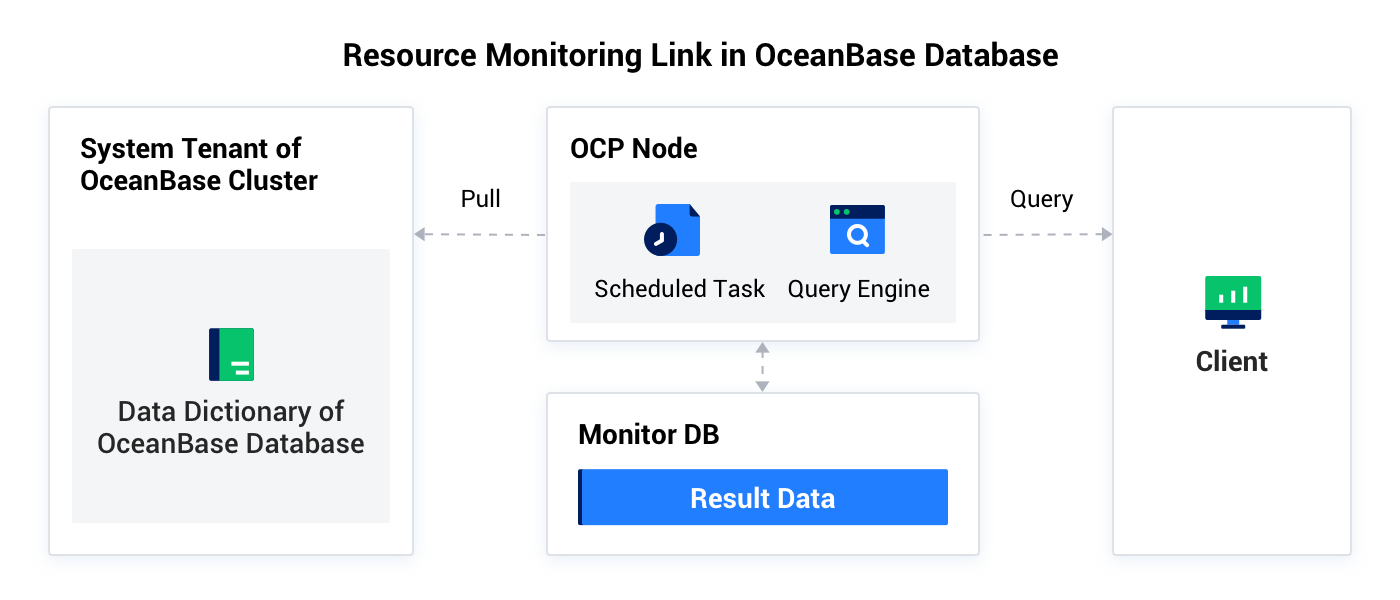
In cluster resource monitoring, metrics of resource usage of the OceanBase cluster are collected from the following sources:
CPU information
GV$OB_SERVERS: total CPU cores and allocated cores.
Memory information
GV$OB_SERVERS: total memory size and used size.
Disk information
GV$OB_SERVERS: total disk size and used information.
System event information
oceanbase.DBA_OB_ROOTSERVICE_EVENT_HISTORY: OceanBase cluster system event information.
OCP schedules tasks to trigger cluster resource monitoring, which uses the sys tenant of each OceanBase cluster to collect the usage information of the CPU resources, memory resources, and disks on OBServer nodes by cluster, tenant, database, and table. The collected data is saved to MonitorDB. When you initiate a query from a client, OCP collects statistics by cluster, tenant, database, and table, and returns the statistics to the client.
Alerting
OceanBase Database mainly uses OCP alerts to provide early warning of risks and faults in production hosts and databases. When a database or its host environment is about to fail or has failed, built-in alert items detect the exception and send alerts to subscribers through alert channels. The alert feature is described from four aspects: alert item configuration, alert detection, alert aggregation, and alert subscription.
Alert items
OCP has about 60 built-in alert items. Each alert item describes basic information such as alert name, level, overview template, and details template, as well as rule information related to alert detection.
Based on risk severity, alerts are divided into five levels: Stopped, Critical, Warning, Caution, and Reminder. When an alert is generated, related template variables are created. Template variables can be configured in the overview and details templates to display necessary context. Alert detection rules are based on monitoring expressions, such as detection duration, detection cycle, alert recovery cycle, and detection expression configuration.
These built-in alert items generally describe alerts from database resources, database events, host resources, and OCP events, such as database resource alerts (CPU, memory, MemStore, disk usage, etc.), database event alerts (merge timeout, hanging transactions, etc.), host network and disk alerts, and OCP alerts (monitoring API status exception, MetaDB synchronization with OB cluster, etc.).
Alert detection
Alert detection is the process of detecting built-in alert items and triggering alerts. It is divided into two types: monitoring expression-based detection and scheduled task logical detection. After alert detection, an alert event is generated (i.e., an alert is produced). Whether the alert event needs to be notified to users depends on the subsequent alert aggregation logic: suppression may be applied to avoid a large number of alert messages.
For monitoring expression-based alerts, monitoring data can be aggregated from different dimensions through the monitoring API, and the API query results can be matched against thresholds. When the alert trigger rule is satisfied, an alert event is generated.
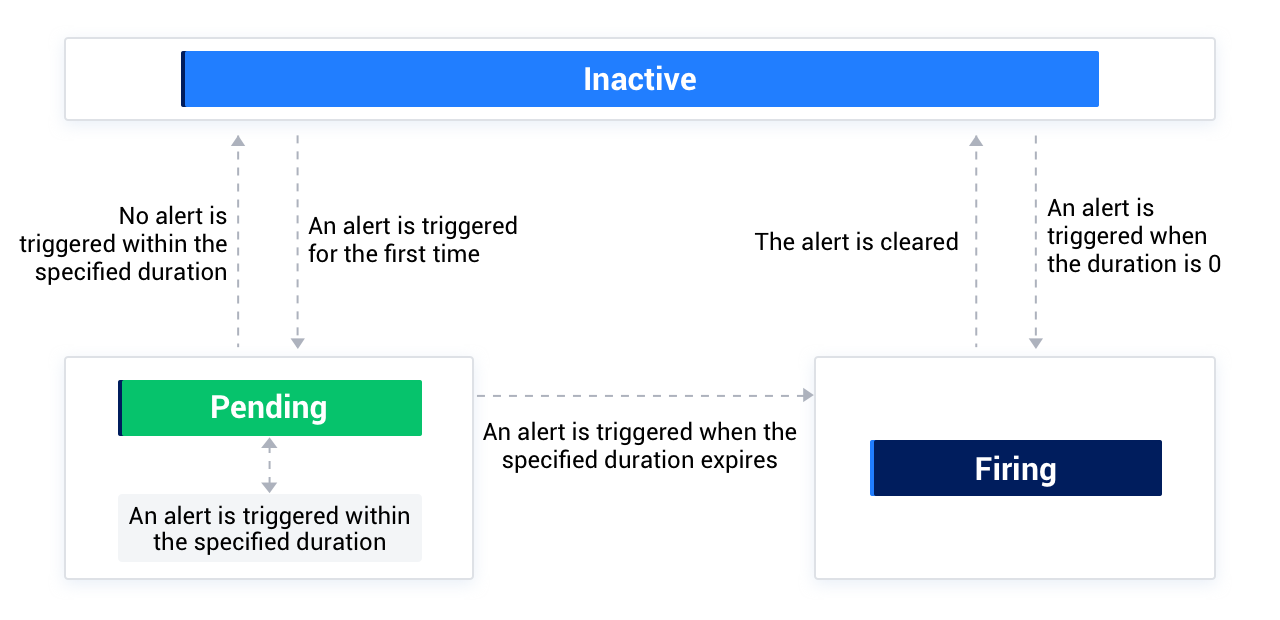
The preceding figure shows the status transition in monitoring expression-based alert detection. duration is the alert detection duration. When alerts are triggered continuously within the duration, an alert event is generated. duration is often used for exception tolerance: an occasional exception is not expected to trigger an alert immediately; only persistent exceptions trigger an alert.
Scheduled task logical detection applies to complex scenarios that require script-based detection. This detection method directly calls the alert API to generate alert events, such as OceanBase log alerts and OMS alerts. It applies to event-based alerts from external systems (systems other than OCP).
Alert aggregation
Aggregation means merging alert messages into a small number of aggregated messages (called aggregate messages) according to preset rules to prevent alert storms.
The following is the alert aggregation configuration. It is a depth-first matching rule. For example, OceanBase log alerts (ob_log_alarm) are aggregated by alarm_type (alert item), ob_error_code (log error code), and obregion (OceanBase cluster name).
aggregate:
# Root layer is the default aggregation; aggregate by alert type and object.
match: {}
group_by:
- "alarm_type"
aggregate_wait_seconds: 10
aggregate_interval_seconds: 60
repeat_interval_seconds: 3600
aggregates:
# For OB alerts, aggregate by alert type and OB cluster.
- match:
app: "OB"
group_by:
- "alarm_type"
- "obregion"
aggregate_wait_seconds: 10
aggregate_interval_seconds: 60
repeat_interval_seconds: 3600
aggregates:
# For OB log alerts, aggregate by alert type, log error code, and OB cluster.
- match:
alarm_type: "ob_log_alarm"
group_by:
- "alarm_type"
- "ob_error_code"
- "obregion"
aggregate_wait_seconds: 10
aggregate_interval_seconds: 60
repeat_interval_seconds: 3600
aggregate_wait_secondsis the wait time when the first alert is generated. Alerts with the same aggregation dimension generated within this time are aggregated into one alert message.aggregate_interval_secondsis the aggregation cycle for the same aggregation dimension, i.e., how often a new aggregated alert message is generated.repeat_interval_secondsis the send cycle for the same alert (same alert ID; the ID does not increase when the alert is not recovered). The same alert is aggregated only in the next repeat_interval_seconds cycle.
Alert subscription
The alert subscription feature makes it easy to send alert messages to different users.
First, alert items are divided into different groups. You can subscribe to an alert group directly. OCP currently divides alert items into the following six groups:
ocp: OCP-related alert items.dba: OceanBase Database-related alert items.info: operational (Info-level) alert items.oms: OMS application alert items.backup: backup and restore alert items.dev: O&M-related alert items.
You can subscribe to alerts by cluster and level, and send different alerts to different alert channels. An alert channel defines how alerts are sent. OCP supports sending via Bash or Python scripts, or via HTTP API. Throttling policies can also be set on channels to avoid sending too many alerts.