OceanBase logo

OceanBase

A unified distributed database ready for your transactional, analytical, and AI workloads.

DEPLOY YOUR WAY

OceanBase Cloud

The best way to deploy and scale OceanBase

OceanBase Enterprise

Run and manage OceanBase on your infra

TRY OPEN SOURCE

OceanBase Community Edition

The free, open-source distributed database

OceanBase seekdb

Open source AI native search database

Customer Stories

Real-world success stories from enterprises across diverse industries.

View All
BY USE CASES

Mission-Critical Transactions

Global & Multicloud Application

Elastic Scaling for Peak Traffic

Real-time Analytics

Active Geo-redundancy

Database Consolidation

Resources

Comprehensive knowledge hub for OceanBase.

Blog

Live Demos

Training & Certification

Documentation

Official technical guides, tutorials, API references, and manuals for all OceanBase products.

View All
PRODUCTS

OceanBase Cloud

OceanBase Database

Tools

Connectors and Middleware

QUICK START

OceanBase Cloud

OceanBase Database

BEST PRACTICES

Practical guides for utilizing OceanBase more effectively and conveniently

Company

Learn more about OceanBase – our company, partnerships, and trust and security initiatives.

About OceanBase

Partner

Trust Center

Contact Us

International - English
中国站 - 简体中文
日本 - 日本語
Sign In
Start on Cloud

A unified distributed database ready for your transactional, analytical, and AI workloads.

DEPLOY YOUR WAY

OceanBase Cloud

The best way to deploy and scale OceanBase

OceanBase Enterprise

Run and manage OceanBase on your infra

TRY OPEN SOURCE

OceanBase Community Edition

The free, open-source distributed database

OceanBase seekdb

Open source AI native search database

Customer Stories

Real-world success stories from enterprises across diverse industries.

View All
BY USE CASES

Mission-Critical Transactions

Global & Multicloud Application

Elastic Scaling for Peak Traffic

Real-time Analytics

Active Geo-redundancy

Database Consolidation

Comprehensive knowledge hub for OceanBase.

Blog

Live Demos

Training & Certification

Documentation

Official technical guides, tutorials, API references, and manuals for all OceanBase products.

View All
PRODUCTS
OceanBase CloudOceanBase Database
ToolsConnectors and Middleware
QUICK START
OceanBase CloudOceanBase Database
BEST PRACTICES

Practical guides for utilizing OceanBase more effectively and conveniently

Learn more about OceanBase – our company, partnerships, and trust and security initiatives.

About OceanBase

Partner

Trust Center

Contact Us

Start on Cloud
编组
All Products
    • Databases
    • iconOceanBase Database
    • iconOceanBase Cloud
    • iconOceanBase Tugraph
    • iconInteractive Tutorials
    • iconOceanBase Best Practices
    • Tools
    • iconOceanBase Cloud Platform
    • iconOceanBase Migration Service
    • iconOceanBase Developer Center
    • iconOceanBase Migration Assessment
    • iconOceanBase Admin Tool
    • iconOceanBase Loader and Dumper
    • iconOceanBase Deployer
    • iconKubernetes operator for OceanBase
    • iconOceanBase Diagnostic Tool
    • iconOceanBase Binlog Service
    • Connectors and Middleware
    • iconOceanBase Database Proxy
    • iconEmbedded SQL in C for OceanBase
    • iconOceanBase Call Interface
    • iconOceanBase Connector/C
    • iconOceanBase Connector/J
    • iconOceanBase Connector/ODBC
    • iconOceanBase Connector/NET
icon

OceanBase Database Proxy

V4.3.1

  • What is ODP?
  • Installation and deployment
    • Overview
    • Deploy ODP by using obd
    • Deploy ODP by using OCP
    • Deploy ODP by using the CLI
    • Deployment modes
  • Basic operations
  • Configuration parameter
    • View and modify parameters
    • Parameter summary
    • Global parameters
      • automatic_match_work_thread
      • block_thread_num
      • cache_cleaner_clean_interval
      • check_tenant_locality_change
      • client_max_connections
      • client_max_memory_size
      • client_session_id_version
      • client_sock_option_flag_out
      • client_tcp_keepcnt
      • client_tcp_keepidle
      • client_tcp_keepintvl
      • client_tcp_user_timeout
      • cluster_count_high_water_mark
      • cluster_expire_time
      • config_server_refresh_interval
      • congestion_fail_window
      • congestion_failure_threshold
      • congestion_retry_interval
      • connection_diagnosis_option
      • connect_observer_max_retries
      • current_local_config_version
      • default_buffer_water_mark
      • default_inactivity_timeout
      • delay_exit_time
      • delay_update_entry_interval
      • detect_server_timeout
      • digest_sql_length
      • enable_abort_conn_info
      • enable_async_log
      • enable_async_pull_location_cache
      • enable_bad_route_reject
      • enable_binlog_service
      • enable_cached_server
      • enable_causal_order_read
      • enable_client_connection_lru_disconnect
      • enable_client_ip_checkout
      • enable_cluster_checkout
      • enable_compression_protocol
      • enable_congestion
      • enable_connection_diagnosis
      • enable_cpu_isolate
      • enable_cpu_topology
      • enable_extra_prometheus_metric
      • enable_flow_control
      • enable_full_link_trace
      • enable_full_username
      • enable_get_rslist_remote
      • enable_global_ps_cache
      • enable_index_route
      • enable_monitor_stat
      • enable_ob_protocol_v2
      • enable_ob_protocol_v2_with_client
      • enable_obproxy_rpc_service
      • enable_partition_table_route
      • enable_performance_mode
      • enable_pl_route
      • enable_primary_zone
      • enable_prometheus
      • enable_proxy_scramble
      • enable_qa_mode
      • enable_qos
      • enable_report_session_stats
      • enable_reroute
      • enable_sequence_prefetch
      • enable_sharding
      • enable_single_leader_node_routing
      • enable_standby
      • enable_stat
      • enable_strict_kernel_release
      • enable_strict_stat_time
      • enable_sync_all_stats
      • enable_syslog_file_compress
      • enable_syslog_wf
      • enable_trace
      • enable_trace_stats
      • enable_trans_detail_stats
      • enable_transaction_internal_routing
      • enable_xa_route
      • fetch_proxy_bin_random_time
      • fetch_proxy_bin_timeout
      • flow_consumer_reenable_threshold
      • flow_event_queue_threshold
      • flow_high_water_mark
      • flow_low_water_mark
      • grpc_client_num
      • grpc_thread_num
      • hot_upgrade_exit_timeout
      • hot_upgrade_failure_retries
      • hot_upgrade_rollback_timeout
      • idc_list_refresh_interval
      • ignore_local_config
      • internal_cmd_mem_limited
      • ip_listen_mode
      • ldg_info_refresh_interval
      • listen_port
      • local_bound_ip
      • local_bound_ipv6_ip
      • log_cleanup_interval
      • log_dir_size_threshold
      • log_file_percentage
      • long_async_task_timeout
      • max_log_file_size
      • max_syslog_file_count
      • max_syslog_file_time
      • mem_leak_check_class_name
      • mem_leak_check_mod_name
      • metadb_server_state_refresh_interval
      • min_congested_connect_timeout
      • min_keep_congestion_interval
      • monitor_cost_ms_unit
      • monitor_item_limit
      • monitor_item_max_idle_period
      • monitor_log_level
      • monitor_stat_dump_interval
      • monitor_stat_high_threshold
      • monitor_stat_low_threshold
      • monitor_stat_middle_threshold
      • need_convert_vip_to_tname
      • net_accept_threads
      • net_config_poll_timeout
      • normal_pl_update_threshold
      • obproxy_config_server_url
      • obproxy_sys_password
      • partition_location_expire_relative_time
      • prometheus_cost_ms_unit
      • prometheus_listen_port
      • prometheus_sync_interval
      • protocol_diagnosis_level
      • proxy_hot_upgrade_check_interval
      • proxy_id
      • proxy_info_check_interval
      • proxy_local_cmd
      • proxy_mem_limited
      • qa_mode_mock_public_cloud_slb_addr
      • qos_stat_clean_interval
      • qos_stat_item_limit
      • refresh_idc_list
      • refresh_json_config
      • refresh_rslist
      • request_buffer_length
      • rootservice_list
      • routing_cache_mem_limited
      • rpc_enable_direct_expire_route_entry
      • rpc_enable_congestion
      • rpc_enable_global_index
      • rpc_enable_force_srv_black_list
      • rpc_enable_reroute
      • rpc_enable_parallel_handler
      • rpc_enable_retry_request_info_log
      • rpc_force_srv_black_list
      • rpc_max_request_batch_size
      • rpc_listen_port
      • rpc_max_response_batch_size
      • rpc_net_timeout_base
      • rpc_max_server_table_entry_num
      • rpc_request_timeout
      • rpc_period_task_interval
      • rpc_server_entry_expire_time
      • rpc_request_timeout_delta
      • rpc_server_net_invalid_time_us
      • rpc_server_net_handler_expire_time
      • rpc_server_net_max_pending_request
      • rpc_srv_session_pool_inactive_timeout
      • rpc_support_key_partition_shard_request
      • sequence_entry_expire_time
      • sequence_fail_retry_count
      • sequence_prefetch_threshold
      • server_detect_fail_threshold
      • server_detect_mode
      • server_detect_refresh_interval
      • server_routing_mode
      • server_state_refresh_interval
      • server_tcp_init_cwnd
      • server_tcp_keepcnt
      • server_tcp_keepidle
      • server_tcp_keepintvl
      • server_tcp_user_timeout
      • shard_scan_thread_num
      • short_async_task_timeout
      • skip_proxy_sys_private_check
      • skip_proxyro_check
      • slow_proxy_process_time_threshold
      • slow_transaction_time_threshold
      • sock_option_flag_out
      • sock_packet_mark_out
      • sock_packet_tos_out
      • sock_recv_buffer_size_out
      • sock_send_buffer_size_out
      • sql_table_cache_expire_relative_time
      • sql_table_cache_mem_limited
      • sqlaudit_mem_limited
      • stack_size
      • stat_dump_interval
      • stat_table_sync_interval
      • syslog_io_bandwidth_limit
      • syslog_level
      • task_thread_num
      • tenant_location_valid_time
      • tunnel_request_size_threshold
      • username_separator
      • work_thread_num
      • xflush_log_level
    • Multi-level parameters
      • binlog_service_ip
      • compression_algorithm
      • enable_client_ssl
      • enable_cloud_full_username
      • enable_read_write_split
      • enable_server_ssl
      • enable_transaction_split
      • enable_weak_reroute
      • mysql_version
      • ob_max_read_stale_time
      • obproxy_force_parallel_query_dop
      • obproxy_read_consistency
      • obproxy_read_only
      • observer_query_timeout_delta
      • observer_sys_password
      • observer_sys_password1
      • proxy_idc_name
      • proxy_primary_zone_name
      • proxy_route_policy
      • proxy_tenant_name
      • query_digest_time_threshold
      • read_stale_retry_interval
      • rootservice_cluster_name
      • route_diagnosis_level
      • slow_query_time_threshold
      • ssl_attributes
      • target_db_server
  • Connection management
    • Principles
    • Session status synchronization
    • Configure a globally unique client session ID
    • Client session
    • Server session
    • Network connection
  • Data routing
    • Factors affecting data routing
    • ODP routing
    • Intra-tenant routing
      • Overview
      • IP address-based routing
      • Partitioned table-based routing for strong-consistency reads
      • Global index table-based routing for strong-consistency reads
      • Replicated table-based routing for strong-consistency reads
      • Primary zone-based routing for strong-consistency reads
      • Strategy-based routing
      • Distributed transaction routing
      • Rerouting
      • Forcible routing
    • Automatic routing to the primary/standby tenants
    • Read/Write separation
    • Follower latency threshold
    • Function partition key routing
      • Overview
      • String functions
      • Numeric calculation functions
      • Date calculation functions
      • FAQ
    • Character set-based routing
  • Logs
    • Overview
    • obproxy_diagnosis.log
    • obproxy_digest.log
    • obproxy_error.log
    • obproxy_slow.log
    • obproxy_stat.log
    • obproxy.log
  • Commands
    • Overview
    • Dedicated ODP commands
      • ALTER
      • KILL
      • ping
      • SHOW
    • Compatible MySQL commands
      • BINLOG
      • KILL
      • SHOW PROCESSLIST
      • SHOW RELAYLOG EVENTS
      • SHOW SLAVE HOSTS
  • High availability mechanism
    • Overview
    • High availability of ODP services
    • High availability of OceanBase Database
    • High availability testing
  • Security and protocols
  • RPC service port
  • Operation and maintenance
    • Troubleshooting logic
    • Performance analysis
    • Show Trace
    • Routing diagnostics
      • Overview
      • Obtain diagnostic information
      • Diagnostic point troubleshooting
        • Overview
        • SQL_PARSE
        • ROUTE_INFO
        • LOCATION_CACHE_LOOKUP
        • ROUTINE_ENTRY_LOOKUP_DONE
        • FETCH_TABLE_RELATED_DATA
        • TABLE_ENTRY_LOOKUP_DONE
        • EXPR_PARSE
        • CALC_ROWID
        • RESOLVE_TOKEN
        • RESOLVE_EXPR
        • CALC_PARTITION_ID
        • PARTITION_ID_CALC_DONE
        • PARTITION_ENTRY_LOOKUP_DONE
        • ROUTE_POLICY
        • CONGESTION_CONTROL
        • RETRY
        • HANDLE_RESPONSE
      • Examples
    • Memory leak diagnostics
    • Connection diagnostics
  • Release Notes
    • Versioning rules
    • Enterprise Edition
      • V4.3
        • ODP Enterprise Edition V4.3.1
        • ODP Enterprise Edition V4.3.0
      • V4.2
        • ODP Enterprise Edition V4.2.3
        • ODP Enterprise Edition V4.2.2
        • ODP Enterprise Edition V4.2.1
      • V4.1
        • ODP Enterprise Edition V4.1.0
      • V4.0
        • ODP Enterprise Edition V4.0.0
      • V3.2
        • ODP Enterprise Edition V3.2.11
        • ODP Enterprise Edition V3.2.3.5
    • Community Edition
      • V4.3
        • ODP Community Edition V4.3.1
      • V4.2
        • ODP Community Edition V4.2.3
        • ODP Community Edition V4.2.1
        • ODP Community Edition V4.2.0
      • V4.1
        • ODP Community Edition V4.1.0
      • V4.0
        • ODP Community Edition V4.0.0

Download PDF

What is ODP? Overview Deploy ODP by using obd Deploy ODP by using OCP Deploy ODP by using the CLI Deployment modes Basic operations View and modify parameters Parameter summary automatic_match_work_thread block_thread_num cache_cleaner_clean_interval check_tenant_locality_change client_max_connections client_max_memory_size client_session_id_version client_sock_option_flag_out client_tcp_keepcnt client_tcp_keepidle client_tcp_keepintvl client_tcp_user_timeout cluster_count_high_water_mark cluster_expire_time config_server_refresh_interval congestion_fail_window congestion_failure_threshold congestion_retry_interval connection_diagnosis_option connect_observer_max_retries current_local_config_version default_buffer_water_mark default_inactivity_timeout delay_exit_time delay_update_entry_interval detect_server_timeout digest_sql_length enable_abort_conn_info enable_async_log enable_async_pull_location_cache enable_bad_route_reject enable_binlog_service enable_cached_server enable_causal_order_read enable_client_connection_lru_disconnect enable_client_ip_checkout enable_cluster_checkout enable_compression_protocol enable_congestion enable_connection_diagnosis enable_cpu_isolate enable_cpu_topology enable_extra_prometheus_metric enable_flow_control enable_full_link_trace enable_full_username enable_get_rslist_remote enable_global_ps_cache enable_index_route enable_monitor_stat enable_ob_protocol_v2 enable_ob_protocol_v2_with_client enable_obproxy_rpc_service enable_partition_table_route enable_performance_mode enable_pl_route enable_primary_zone enable_prometheus enable_proxy_scramble enable_qa_mode enable_qos enable_report_session_stats enable_reroute enable_sequence_prefetch enable_sharding enable_single_leader_node_routing enable_standby enable_stat enable_strict_kernel_release enable_strict_stat_time enable_sync_all_stats enable_syslog_file_compress enable_syslog_wf enable_trace enable_trace_stats enable_trans_detail_stats enable_transaction_internal_routing enable_xa_route fetch_proxy_bin_random_time fetch_proxy_bin_timeout flow_consumer_reenable_threshold flow_event_queue_threshold flow_high_water_mark flow_low_water_mark grpc_client_num grpc_thread_num hot_upgrade_exit_timeout hot_upgrade_failure_retries hot_upgrade_rollback_timeout idc_list_refresh_interval ignore_local_config
OceanBase logo

The Unified Distributed Database for the Al Era.

Follow Us
Products
OceanBase CloudOceanBase EnterpriseOceanBase Community EditionOceanBase seekdb
Resources
DocsBlogLive DemosTraining & Certification
Company
About OceanBaseTrust CenterLegalPartnerContact Us
Follow Us

© OceanBase 2026. All rights reserved

Cloud Service AgreementPrivacy PolicySecurity
Contact Us
Document Feedback
  1. Documentation Center
  2. OceanBase Database Proxy
  3. V4.3.1
iconOceanBase Database Proxy
V 4.3.1
  • V 4.3.4
  • V 4.3.3
  • V 4.3.2
  • V 4.3.1
  • V 4.3.0
  • V 4.2.3
  • V 4.2.2
  • V 4.2.0 and earlier

Performance analysis

Last Updated:2025-01-24 01:53:30  Updated
share
What is on this page
Basic theories
Performance tuning
Performance tuning procedure
ODP performance
Data summary
Troubleshooting
Thread model
Parameter adjustment
Routing accuracy
Process performance analysis

folded

share

Basic theories

Performance tuning

Performance tuning aims to make full use of the software and hardware capabilities to achieve the best system performance and improve the cost performance of the software and hardware in production environment, thereby lowering the costs for customers. You can run the perf stat command collect the hardware performance metrics within a period of time, as shown in the following example:

Performance counter stats for process id '3260':

   182250.331423      task-clock (msec)         #   18.221 CPUs utilized
      3,259,379      context-switches          #    0.018 M/sec
      1,628,966      cpu-migrations            #    0.009 M/sec
               51      page-faults               #    0.000 K/sec
442,995,845,816      cycles                    #    2.431 GHz
226,812,458,841      instructions              #    0.51  insn per cycle
   45,556,284,037      branches                  #  249.965 M/sec
      662,510,643      branch-misses             #    1.45% of all branches

   10.002402740 seconds time elapsed

Performance tuning procedure

The performance tuning procedure is as follows:

  1. Determine the optimization objectives.

    1. Throughput: Pay attention to the CPU information and component bottlenecks. At present, both the ODP and OBServers can exhaust CPU resources.

    2. Latency: Pay attention to the number of components on the access link and the time consumption on each segment. The network latency must also be considered.

    3. Experience: From a global perspective, performance tuning performed nearer to the business system achieves better effects.

  2. Perform stress testing and collect required information: Besides the target data, you must also collect other data such as the CPU usage and network latency of each component.

  3. Analyze the stress and identify the performance bottleneck: Based on the collected data, identify the component that causes the bottleneck and then perform detailed analysis.

  4. Implement optimization: Adjust parameters and deployments. In special cases, you may need to modify the code and release a new version.

  5. Confirm the optimization effect: Observe whether the throughput and latency meet the customer requirements or test results.

ODP performance

Data summary

Performance data:

  • Queries per second (QPS) = Concurrency × 1000 ms/RT)

  • Response time (RT) = 1000 ms/(QPS/Concurrency)

  • The network latency within an IDC is within 100 μs.

  • The forwarding efficiency of the OBServer is lower than 50% of the forwarding efficiency of ODP.

ODP performance data:

  • In the case of exclusive use, the QPS is between 20,000 and 35,000 and affected by factors such as the CPU model. The QPS will be higher if the stress is low and hyper-threading (HT) is not used.

  • If the ODP is deployed on the same physical server as an OBServer node, resource preemption occurs. In this case, the performance will be higher if load balancing is configured for ODP.

  • Compared with other deployment modes, deployment on the application side achieves the best performance.

  • The advanced RISC machine (ARM) platform is supported but its performance is lower than that of the x86 platform.

Troubleshooting

The issues of ODP are mainly related to the QPS and RT.

  • QPS: You can improve the QPS through scale-out. If scale-out is not supported, you can improve the performance of individual ODP instances. If the CPU resources are sufficient but the QPS is low, you must analyze the issue based on the actual situation.

  • RT: You can view the execution time on the ODP in slow query logs. The execution time on the ODP is at the μs level. The RT is greatly affected by the overall architecture.

When you handle issues, you must be clear with your objectives. For example, if data migration by using OceanBase Migration Service (OMS) is slow because the ODP has become a bottleneck due to full CPU utilization, you can increase the number of ODP instances.
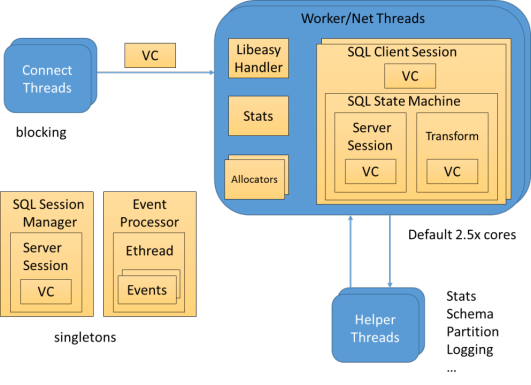
Thread model

You can add the -H parameter to the top command to check the thread status. The worker threads of ODP are obproxy and the threads whose name starts with ET NET. In ODP, threads basically share nothing with each other and each thread can work independently. Requests can be evenly distributed to the worker threads.

Model diagram

Parameter adjustment

Parameters involved in performance tuning:

alter proxyconfig set enable_compression_protocol=false; -- Disable compression to reduce the CPU utilization.
alter proxyconfig set proxy_mem_limited='16G'; --You can dynamically adjust the value as needed to prevent out-of-memory (OOM) errors.
alter proxyconfig set enable_prometheus=false;
alter proxyconfig set enable_metadb_used=false;
alter proxyconfig set enable_standby=false;
alter proxyconfig set enable_strict_stat_time=false;
alter proxyconfig set use_local_dbconfig=true; This parameter is available in ODP V3.x and later.
alter proxyconfig set work_thread_num= xxx; --xxx must be smaller than or equal to the actual number of cores.

Routing accuracy

The forwarding efficiency of an OBServer is lower than that of ODP. Therefore, the routing accuracy of ODP is essential in core scenarios, for which local plans are recommended. This is not required in non-core scenarios. At present, ODP supports routing based on regular tables, partitioned tables, logical data centers (LDCs), and primary zones. For more information, see Data routing.

Process performance analysis

Thread model data

The following table describes the CPU usage under the assumption that the QPS is 100,000.

Number of threads QPS CPU usage IPC Context switching
4 100021.12 3.979 0.49 19746 context-switches # 0.165 K/sec
4043 cpu-migrations # 0.034 K/sec
8 99985.25 5.816 0.36 1294736 context-switches # 0.007 M/sec (100.00%)
19267 cpu-migrations # 0.110 K/sec (100.00%)
12 99943.38 6.763 0.33 2239606 context-switches # 0.011 M/sec (100.00%)
80049 cpu-migrations # 0.395 K/sec (100.00%)
16 99912.43 7.345 0.31 2885634 context-switches # 0.013 M/sec (100.00%)
172082 cpu-migrations # 0.781 K/sec (100.00%)
20 99959.15 8.102 0.33 3256951 context-switches # 0.013 M/sec (100.00%)
296914 cpu-migrations # 0.001 M/sec (99.99%)
24 100032.52 8.156 0.29 3673410 context-switches # 0.015 M/sec (100.00%)
471850 cpu-migrations # 0.002 M/sec (100.00%)

View performance data by using tools

You can view performance data by using the following tools.

  1. top command

    1. You can use the top command to view the CPU utilization of an ODP in real time. If the CPU utilization of the ODP exceeds that of the OBServer, the ODP performance is abnormal and further analysis is required.

    2. You can use the top -H command to view the CPU utilization of threads, which is steady in normal cases.

  2. perf command

    1. You can use the perf top command to view hotspot functions. At present, no functions in ODP has a CPU utilization of more than 5%.

    2. You can use the perf stat command to view hardware metrics, which are helpful in analyzing the performance of CPUs of different models.

  3. Log printing

    Logging severely compromises performance. You can check the ODP log generation interval. If a log is generated every 1 to 2 seconds, the performance will be significantly downgraded.

Previous topic

Troubleshooting logic
Last

Next topic

Show Trace
Next
What is on this page
Basic theories
Performance tuning
Performance tuning procedure
ODP performance
Data summary
Troubleshooting
Thread model
Parameter adjustment
Routing accuracy
Process performance analysis