OceanBase logo

OceanBase

A unified distributed database ready for your transactional, analytical, and AI workloads.

DEPLOY YOUR WAY

OceanBase Cloud

The best way to deploy and scale OceanBase

OceanBase Enterprise

Run and manage OceanBase on your infra

TRY OPEN SOURCE

OceanBase Community Edition

The free, open-source distributed database

OceanBase seekdb

Open source AI native search database

Customer Stories

Real-world success stories from enterprises across diverse industries.

View All
BY USE CASES

Mission-Critical Transactions

Global & Multicloud Application

Elastic Scaling for Peak Traffic

Real-time Analytics

Active Geo-redundancy

Database Consolidation

Resources

Comprehensive knowledge hub for OceanBase.

Blog

Live Demos

Training & Certification

Documentation

Official technical guides, tutorials, API references, and manuals for all OceanBase products.

View All
PRODUCTS

OceanBase Cloud

OceanBase Database

Tools

Connectors and Middleware

QUICK START

OceanBase Cloud

OceanBase Database

BEST PRACTICES

Practical guides for utilizing OceanBase more effectively and conveniently

Company

Learn more about OceanBase – our company, partnerships, and trust and security initiatives.

About OceanBase

Partner

Trust Center

Contact Us

International - English
中国站 - 简体中文
日本 - 日本語
Sign In
Start on Cloud

A unified distributed database ready for your transactional, analytical, and AI workloads.

DEPLOY YOUR WAY

OceanBase Cloud

The best way to deploy and scale OceanBase

OceanBase Enterprise

Run and manage OceanBase on your infra

TRY OPEN SOURCE

OceanBase Community Edition

The free, open-source distributed database

OceanBase seekdb

Open source AI native search database

Customer Stories

Real-world success stories from enterprises across diverse industries.

View All
BY USE CASES

Mission-Critical Transactions

Global & Multicloud Application

Elastic Scaling for Peak Traffic

Real-time Analytics

Active Geo-redundancy

Database Consolidation

Comprehensive knowledge hub for OceanBase.

Blog

Live Demos

Training & Certification

Documentation

Official technical guides, tutorials, API references, and manuals for all OceanBase products.

View All
PRODUCTS
OceanBase CloudOceanBase Database
ToolsConnectors and Middleware
QUICK START
OceanBase CloudOceanBase Database
BEST PRACTICES

Practical guides for utilizing OceanBase more effectively and conveniently

Learn more about OceanBase – our company, partnerships, and trust and security initiatives.

About OceanBase

Partner

Trust Center

Contact Us

Start on Cloud
编组
All Products
    • Databases
    • iconOceanBase Database
    • iconOceanBase Cloud
    • iconOceanBase Tugraph
    • iconInteractive Tutorials
    • iconOceanBase Best Practices
    • Tools
    • iconOceanBase Cloud Platform
    • iconOceanBase Migration Service
    • iconOceanBase Developer Center
    • iconOceanBase Migration Assessment
    • iconOceanBase Admin Tool
    • iconOceanBase Loader and Dumper
    • iconOceanBase Deployer
    • iconKubernetes operator for OceanBase
    • iconOceanBase Diagnostic Tool
    • iconOceanBase Binlog Service
    • Connectors and Middleware
    • iconOceanBase Database Proxy
    • iconEmbedded SQL in C for OceanBase
    • iconOceanBase Call Interface
    • iconOceanBase Connector/C
    • iconOceanBase Connector/J
    • iconOceanBase Connector/ODBC
    • iconOceanBase Connector/NET
icon

OceanBase Database Proxy

V4.3.1

  • What is ODP?
  • Installation and deployment
    • Overview
    • Deploy ODP by using obd
    • Deploy ODP by using OCP
    • Deploy ODP by using the CLI
    • Deployment modes
  • Basic operations
  • Configuration parameter
    • View and modify parameters
    • Parameter summary
    • Global parameters
      • automatic_match_work_thread
      • block_thread_num
      • cache_cleaner_clean_interval
      • check_tenant_locality_change
      • client_max_connections
      • client_max_memory_size
      • client_session_id_version
      • client_sock_option_flag_out
      • client_tcp_keepcnt
      • client_tcp_keepidle
      • client_tcp_keepintvl
      • client_tcp_user_timeout
      • cluster_count_high_water_mark
      • cluster_expire_time
      • config_server_refresh_interval
      • congestion_fail_window
      • congestion_failure_threshold
      • congestion_retry_interval
      • connection_diagnosis_option
      • connect_observer_max_retries
      • current_local_config_version
      • default_buffer_water_mark
      • default_inactivity_timeout
      • delay_exit_time
      • delay_update_entry_interval
      • detect_server_timeout
      • digest_sql_length
      • enable_abort_conn_info
      • enable_async_log
      • enable_async_pull_location_cache
      • enable_bad_route_reject
      • enable_binlog_service
      • enable_cached_server
      • enable_causal_order_read
      • enable_client_connection_lru_disconnect
      • enable_client_ip_checkout
      • enable_cluster_checkout
      • enable_compression_protocol
      • enable_congestion
      • enable_connection_diagnosis
      • enable_cpu_isolate
      • enable_cpu_topology
      • enable_extra_prometheus_metric
      • enable_flow_control
      • enable_full_link_trace
      • enable_full_username
      • enable_get_rslist_remote
      • enable_global_ps_cache
      • enable_index_route
      • enable_monitor_stat
      • enable_ob_protocol_v2
      • enable_ob_protocol_v2_with_client
      • enable_obproxy_rpc_service
      • enable_partition_table_route
      • enable_performance_mode
      • enable_pl_route
      • enable_primary_zone
      • enable_prometheus
      • enable_proxy_scramble
      • enable_qa_mode
      • enable_qos
      • enable_report_session_stats
      • enable_reroute
      • enable_sequence_prefetch
      • enable_sharding
      • enable_single_leader_node_routing
      • enable_standby
      • enable_stat
      • enable_strict_kernel_release
      • enable_strict_stat_time
      • enable_sync_all_stats
      • enable_syslog_file_compress
      • enable_syslog_wf
      • enable_trace
      • enable_trace_stats
      • enable_trans_detail_stats
      • enable_transaction_internal_routing
      • enable_xa_route
      • fetch_proxy_bin_random_time
      • fetch_proxy_bin_timeout
      • flow_consumer_reenable_threshold
      • flow_event_queue_threshold
      • flow_high_water_mark
      • flow_low_water_mark
      • grpc_client_num
      • grpc_thread_num
      • hot_upgrade_exit_timeout
      • hot_upgrade_failure_retries
      • hot_upgrade_rollback_timeout
      • idc_list_refresh_interval
      • ignore_local_config
      • internal_cmd_mem_limited
      • ip_listen_mode
      • ldg_info_refresh_interval
      • listen_port
      • local_bound_ip
      • local_bound_ipv6_ip
      • log_cleanup_interval
      • log_dir_size_threshold
      • log_file_percentage
      • long_async_task_timeout
      • max_log_file_size
      • max_syslog_file_count
      • max_syslog_file_time
      • mem_leak_check_class_name
      • mem_leak_check_mod_name
      • metadb_server_state_refresh_interval
      • min_congested_connect_timeout
      • min_keep_congestion_interval
      • monitor_cost_ms_unit
      • monitor_item_limit
      • monitor_item_max_idle_period
      • monitor_log_level
      • monitor_stat_dump_interval
      • monitor_stat_high_threshold
      • monitor_stat_low_threshold
      • monitor_stat_middle_threshold
      • need_convert_vip_to_tname
      • net_accept_threads
      • net_config_poll_timeout
      • normal_pl_update_threshold
      • obproxy_config_server_url
      • obproxy_sys_password
      • partition_location_expire_relative_time
      • prometheus_cost_ms_unit
      • prometheus_listen_port
      • prometheus_sync_interval
      • protocol_diagnosis_level
      • proxy_hot_upgrade_check_interval
      • proxy_id
      • proxy_info_check_interval
      • proxy_local_cmd
      • proxy_mem_limited
      • qa_mode_mock_public_cloud_slb_addr
      • qos_stat_clean_interval
      • qos_stat_item_limit
      • refresh_idc_list
      • refresh_json_config
      • refresh_rslist
      • request_buffer_length
      • rootservice_list
      • routing_cache_mem_limited
      • rpc_enable_direct_expire_route_entry
      • rpc_enable_congestion
      • rpc_enable_global_index
      • rpc_enable_force_srv_black_list
      • rpc_enable_reroute
      • rpc_enable_parallel_handler
      • rpc_enable_retry_request_info_log
      • rpc_force_srv_black_list
      • rpc_max_request_batch_size
      • rpc_listen_port
      • rpc_max_response_batch_size
      • rpc_net_timeout_base
      • rpc_max_server_table_entry_num
      • rpc_request_timeout
      • rpc_period_task_interval
      • rpc_server_entry_expire_time
      • rpc_request_timeout_delta
      • rpc_server_net_invalid_time_us
      • rpc_server_net_handler_expire_time
      • rpc_server_net_max_pending_request
      • rpc_srv_session_pool_inactive_timeout
      • rpc_support_key_partition_shard_request
      • sequence_entry_expire_time
      • sequence_fail_retry_count
      • sequence_prefetch_threshold
      • server_detect_fail_threshold
      • server_detect_mode
      • server_detect_refresh_interval
      • server_routing_mode
      • server_state_refresh_interval
      • server_tcp_init_cwnd
      • server_tcp_keepcnt
      • server_tcp_keepidle
      • server_tcp_keepintvl
      • server_tcp_user_timeout
      • shard_scan_thread_num
      • short_async_task_timeout
      • skip_proxy_sys_private_check
      • skip_proxyro_check
      • slow_proxy_process_time_threshold
      • slow_transaction_time_threshold
      • sock_option_flag_out
      • sock_packet_mark_out
      • sock_packet_tos_out
      • sock_recv_buffer_size_out
      • sock_send_buffer_size_out
      • sql_table_cache_expire_relative_time
      • sql_table_cache_mem_limited
      • sqlaudit_mem_limited
      • stack_size
      • stat_dump_interval
      • stat_table_sync_interval
      • syslog_io_bandwidth_limit
      • syslog_level
      • task_thread_num
      • tenant_location_valid_time
      • tunnel_request_size_threshold
      • username_separator
      • work_thread_num
      • xflush_log_level
    • Multi-level parameters
      • binlog_service_ip
      • compression_algorithm
      • enable_client_ssl
      • enable_cloud_full_username
      • enable_read_write_split
      • enable_server_ssl
      • enable_transaction_split
      • enable_weak_reroute
      • mysql_version
      • ob_max_read_stale_time
      • obproxy_force_parallel_query_dop
      • obproxy_read_consistency
      • obproxy_read_only
      • observer_query_timeout_delta
      • observer_sys_password
      • observer_sys_password1
      • proxy_idc_name
      • proxy_primary_zone_name
      • proxy_route_policy
      • proxy_tenant_name
      • query_digest_time_threshold
      • read_stale_retry_interval
      • rootservice_cluster_name
      • route_diagnosis_level
      • slow_query_time_threshold
      • ssl_attributes
      • target_db_server
  • Connection management
    • Principles
    • Session status synchronization
    • Configure a globally unique client session ID
    • Client session
    • Server session
    • Network connection
  • Data routing
    • Factors affecting data routing
    • ODP routing
    • Intra-tenant routing
      • Overview
      • IP address-based routing
      • Partitioned table-based routing for strong-consistency reads
      • Global index table-based routing for strong-consistency reads
      • Replicated table-based routing for strong-consistency reads
      • Primary zone-based routing for strong-consistency reads
      • Strategy-based routing
      • Distributed transaction routing
      • Rerouting
      • Forcible routing
    • Automatic routing to the primary/standby tenants
    • Read/Write separation
    • Follower latency threshold
    • Function partition key routing
      • Overview
      • String functions
      • Numeric calculation functions
      • Date calculation functions
      • FAQ
    • Character set-based routing
  • Logs
    • Overview
    • obproxy_diagnosis.log
    • obproxy_digest.log
    • obproxy_error.log
    • obproxy_slow.log
    • obproxy_stat.log
    • obproxy.log
  • Commands
    • Overview
    • Dedicated ODP commands
      • ALTER
      • KILL
      • ping
      • SHOW
    • Compatible MySQL commands
      • BINLOG
      • KILL
      • SHOW PROCESSLIST
      • SHOW RELAYLOG EVENTS
      • SHOW SLAVE HOSTS
  • High availability mechanism
    • Overview
    • High availability of ODP services
    • High availability of OceanBase Database
    • High availability testing
  • Security and protocols
  • RPC service port
  • Operation and maintenance
    • Troubleshooting logic
    • Performance analysis
    • Show Trace
    • Routing diagnostics
      • Overview
      • Obtain diagnostic information
      • Diagnostic point troubleshooting
        • Overview
        • SQL_PARSE
        • ROUTE_INFO
        • LOCATION_CACHE_LOOKUP
        • ROUTINE_ENTRY_LOOKUP_DONE
        • FETCH_TABLE_RELATED_DATA
        • TABLE_ENTRY_LOOKUP_DONE
        • EXPR_PARSE
        • CALC_ROWID
        • RESOLVE_TOKEN
        • RESOLVE_EXPR
        • CALC_PARTITION_ID
        • PARTITION_ID_CALC_DONE
        • PARTITION_ENTRY_LOOKUP_DONE
        • ROUTE_POLICY
        • CONGESTION_CONTROL
        • RETRY
        • HANDLE_RESPONSE
      • Examples
    • Memory leak diagnostics
    • Connection diagnostics
  • Release Notes
    • Versioning rules
    • Enterprise Edition
      • V4.3
        • ODP Enterprise Edition V4.3.1
        • ODP Enterprise Edition V4.3.0
      • V4.2
        • ODP Enterprise Edition V4.2.3
        • ODP Enterprise Edition V4.2.2
        • ODP Enterprise Edition V4.2.1
      • V4.1
        • ODP Enterprise Edition V4.1.0
      • V4.0
        • ODP Enterprise Edition V4.0.0
      • V3.2
        • ODP Enterprise Edition V3.2.11
        • ODP Enterprise Edition V3.2.3.5
    • Community Edition
      • V4.3
        • ODP Community Edition V4.3.1
      • V4.2
        • ODP Community Edition V4.2.3
        • ODP Community Edition V4.2.1
        • ODP Community Edition V4.2.0
      • V4.1
        • ODP Community Edition V4.1.0
      • V4.0
        • ODP Community Edition V4.0.0

Download PDF

What is ODP? Overview Deploy ODP by using obd Deploy ODP by using OCP Deploy ODP by using the CLI Deployment modes Basic operations View and modify parameters Parameter summary automatic_match_work_thread block_thread_num cache_cleaner_clean_interval check_tenant_locality_change client_max_connections client_max_memory_size client_session_id_version client_sock_option_flag_out client_tcp_keepcnt client_tcp_keepidle client_tcp_keepintvl client_tcp_user_timeout cluster_count_high_water_mark cluster_expire_time config_server_refresh_interval congestion_fail_window congestion_failure_threshold congestion_retry_interval connection_diagnosis_option connect_observer_max_retries current_local_config_version default_buffer_water_mark default_inactivity_timeout delay_exit_time delay_update_entry_interval detect_server_timeout digest_sql_length enable_abort_conn_info enable_async_log enable_async_pull_location_cache enable_bad_route_reject enable_binlog_service enable_cached_server enable_causal_order_read enable_client_connection_lru_disconnect enable_client_ip_checkout enable_cluster_checkout enable_compression_protocol enable_congestion enable_connection_diagnosis enable_cpu_isolate enable_cpu_topology enable_extra_prometheus_metric enable_flow_control enable_full_link_trace enable_full_username enable_get_rslist_remote enable_global_ps_cache enable_index_route enable_monitor_stat enable_ob_protocol_v2 enable_ob_protocol_v2_with_client enable_obproxy_rpc_service enable_partition_table_route enable_performance_mode enable_pl_route enable_primary_zone enable_prometheus enable_proxy_scramble enable_qa_mode enable_qos enable_report_session_stats enable_reroute enable_sequence_prefetch enable_sharding enable_single_leader_node_routing enable_standby enable_stat enable_strict_kernel_release enable_strict_stat_time enable_sync_all_stats enable_syslog_file_compress enable_syslog_wf enable_trace enable_trace_stats enable_trans_detail_stats enable_transaction_internal_routing enable_xa_route fetch_proxy_bin_random_time fetch_proxy_bin_timeout flow_consumer_reenable_threshold flow_event_queue_threshold flow_high_water_mark flow_low_water_mark grpc_client_num grpc_thread_num hot_upgrade_exit_timeout hot_upgrade_failure_retries hot_upgrade_rollback_timeout idc_list_refresh_interval ignore_local_config
OceanBase logo

The Unified Distributed Database for the Al Era.

Follow Us
Products
OceanBase CloudOceanBase EnterpriseOceanBase Community EditionOceanBase seekdb
Resources
DocsBlogLive DemosTraining & Certification
Company
About OceanBaseTrust CenterLegalPartnerContact Us
Follow Us

© OceanBase 2026. All rights reserved

Cloud Service AgreementPrivacy PolicySecurity
Contact Us
Document Feedback
  1. Documentation Center
  2. OceanBase Database Proxy
  3. V4.3.1
iconOceanBase Database Proxy
V 4.3.1
  • V 4.3.4
  • V 4.3.3
  • V 4.3.2
  • V 4.3.1
  • V 4.3.0
  • V 4.2.3
  • V 4.2.2
  • V 4.2.0 and earlier

Show Trace

Last Updated:2025-01-24 01:53:30  Updated
share
What is on this page
Background
Supported versions of the components
Considerations
Procedure
Step 1: Configure the components
Step 2: Enable the Show Trace feature and execute the target SQL query
Step 3: Use the Show Trace feature
Step 4: Disable the Show Trace feature

folded

share

The Show Trace feature can interactively provide the statistics and distribution of time consumed in different phases of the last executed SQL request, thereby facilitating bottleneck analysis and problem demarcation. This topic describes how to use the Show Trace feature.

Background

Database issues related to time consumption are difficult to locate and troubleshoot. These issues involve many components, such as client applications, drivers, load balancers, proxies, and databases. OceanBase Database V4.x provides the end-to-end tracing feature to streamline the interactions between these components. This allows you to view the time consumption of each SQL statement, analyze issues, and identify bottlenecks.

Supported versions of the components

  • OceanBase Database: V4.2.0 and later

  • OceanBase Database Proxy (ODP): V4.2.0 and later

  • Java Database Connectivity (JDBC): V2.4.3 and later

  • OceanBase Client (OBClient): V2.2.3 and later

  • OceanBase Cloud Platform (OCP): V4.0.3 and later

Note

Native MySQL drivers do not support the Show Trace feature. If you want to use all capabilities of Show Trace, we recommend that you use OBClient and OceanBase JDBC driver.

Considerations

The Show Trace feature is released with OceanBase Database V4.2.0 and uses the OceanBase 2.0 protocol. Pay attention to the following points about this feature:

  • When you use the end-to-end tracing feature along with components of the supported versions, you can use a session-level switch to turn on session-level Show Trace capabilities. Then, the information about each SQL interaction with the driver, OceanBase Database Proxy (ODP), and OceanBase Database will be recorded. After an SQL request is executed, you can run the show trace command to query the diagnostic information about the SQL execution record.

  • The diagnostic information generated by the Show Trace feature is exchanged between the driver, ODP, and OceanBase Database. You can view the complete path record.

  • By default, the Show Trace feature is disabled. The protocol-based transmission of the diagnostic information incurs extra overhead in parsing, transmission, and record processing. This degrades the performance. Therefore, by default, components do not record Show Trace information.

  • Like the end-to-end tracing feature, the Show Trace feature uses a protocol and is implemented based on interactions. If the version of a component is incorrect or Show Trace is disabled, the results of interactions between the upstream and downstream components are affected. The following scenarios may exist.

    • If the Show Trace feature is not supported or is disabled in OceanBase Database, the overall Show Trace capabilities are unavailable.

    • If Show Trace is supported and enabled in OceanBase Database but the driver and ODP do not support Show Trace, you can run the show trace command to obtain the interaction information about the last SQL request. However, you can obtain only the information about interactions in OceanBase Database.

    • If Show Trace is supported and enabled in OceanBase Database and ODP but the driver does not support Show Trace, you can run the show trace command to obtain the interaction information about the last SQL request. However, you can obtain only the information about interactions in ODP and OceanBase Database.

    • If Show Trace is supported and enabled in the driver, ODP, and OceanBase Database, you can run the show trace command in the session to obtain complete interaction information about the last SQL request at the database layer.

Procedure

Step 1: Configure the components

To use the Show Trace feature, make sure that the versions of the components are correct and that the OceanBase 2.0 protocol and the end-to-end tracing feature are enabled.

  1. In ODP, you can use the enable_ob_protocol_v2_with_client and enable_ob_protocol_v2 parameters to respectively control whether to enable the OceanBase 2.0 protocol between ODP and the driver and between ODP and OceanBase Database. The default value of enable_ob_protocol_v2_with_client is false and that of enable_ob_protocol_v2 is true. You can configure ODP in the following ways:

    • Method 1: Perform the configuration by using the -o option when the ODP process starts.

      cd /opt/taobao/install/obproxy
      ./bin/obproxy -o enable_ob_protocol_v2_with_client=true,enable_ob_protocol_v2=true
      
    • Method 2: Log on to the proxysys tenant as the root user and execute the following SQL statement:

      obclient> alter proxyconfig set enable_ob_protocol_v2_with_client=true;
      obclient> alter proxyconfig set enable_ob_protocol_v2=true;
      
  2. Configure OBClient by using environment variables.

    1. Run the following command to enable the OceanBase 2.0 protocol. The value 0 specifies to disable the protocol, and 1 specifies to enable the protocol.

      export ENABLE_PROTOCOL_OB20=1;
      
    2. Run the following command to enable the end-to-end tracing feature. The value 0 specifies to disable the feature, and 1 specifies to enable the feature.

      export ENABLE_TRACE=1;
      
  3. Add enableFullLinkTrace=true or useOceanBaseProtocolV20=true&enableFullLinkTrace=true to the JDBC URL to enable the end-to-end tracing feature for JDBC.

Step 2: Enable the Show Trace feature and execute the target SQL query

  1. If Show Trace is supported in all required components and the OceanBase 2.0 protocol is enabled, you can enable the end-to-end tracing feature. Then, connect to your OceanBase database by using a client and run the following command to enable session-level Show Trace:

    obclient> set ob_enable_show_trace='on';
    
  2. Execute the target SQL request, which is show tables; in the following example.

    obclient> show tables;
    +----------------------------+
    | Tables_in_test             |
    +----------------------------+
    | t                          |
    | t1                         |
    | t2                         |
    +----------------------------+
    3 rows in set
    

Step 3: Use the Show Trace feature

You can run the show trace; command to obtain the result set or run the show trace format='json'; command to obtain the result set in JSON format.

  • Run the show trace; command to obtain the result set.

    • Example 1: If ODP and the OBServer node are deployed on different servers, run the show trace; command to view the execution records of this SQL request. Sample result:

      obclient> show trace;
      +-----------------------------------------------+----------------------------+------------+
      | Operation                                     | StartTime                  | ElapseTime |
      +-----------------------------------------------+----------------------------+------------+
      | obclient                                      | 2023-06-30 15:29:31.402635 | 43.410 ms  |
      | └── ob_proxy                                  | 2023-06-30 15:29:31.202131 | 43.210 ms  |
      |     ├── ob_proxy_partition_location_lookup    | 2023-06-30 15:29:31.202222 | 0.015 ms   |
      |     └── ob_proxy_server_process_req           | 2023-06-30 15:29:31.202662 | 42.023 ms  |
      |         └── com_query_process                 | 2023-06-30 15:29:31.222125 | 2.889 ms   |
      |             └── mpquery_single_stmt           | 2023-06-30 15:29:31.222142 | 2.862 ms   |
      |                 ├── sql_compile               | 2023-06-30 15:29:31.222153 | 2.406 ms   |
      |                 │   ├── pc_get_plan           | 2023-06-30 15:29:31.222157 | 0.006 ms   |
      |                 │   └── hard_parse            | 2023-06-30 15:29:31.222225 | 2.308 ms   |
      |                 │       ├── parse             | 2023-06-30 15:29:31.222233 | 0.022 ms   |
      |                 │       ├── resolve           | 2023-06-30 15:29:31.222278 | 0.491 ms   |
      |                 │       ├── rewrite           | 2023-06-30 15:29:31.222829 | 0.872 ms   |
      |                 │       ├── optimize          | 2023-06-30 15:29:31.223723 | 0.544 ms   |
      |                 │       └── code_generate     | 2023-06-30 15:29:31.224283 | 0.129 ms   |
      |                 └── sql_execute               | 2023-06-30 15:29:31.224569 | 0.347 ms   |
      |                     ├── open                  | 2023-06-30 15:29:31.224570 | 0.023 ms   |
      |                     ├── response_result       | 2023-06-30 15:29:31.224601 | 0.233 ms   |
      |                     │   └── do_local_das_task | 2023-06-30 15:29:31.224619 | 0.093 ms   |
      |                     └── close                 | 2023-06-30 15:29:31.224843 | 0.057 ms   |
      |                         ├── close_das_task    | 2023-06-30 15:29:31.224846 | 0.005 ms   |
      |                         └── end_transaction   | 2023-06-30 15:29:31.224889 | 0.002 ms   |
      +-----------------------------------------------+----------------------------+------------+
      20 rows in set
      
    • Example 2: If ODP and the OBServer node are deployed on the same server, run the show trace; command to view the execution records of this SQL request. Sample result:

      obclient> show trace;
      +-----------------------------------------------+----------------------------+------------+
      | Operation                                     | StartTime                  | ElapseTime |
      +-----------------------------------------------+----------------------------+------------+
      | obclient                                      | 2023-06-30 15:30:59.812735 | 2.957 ms   |
      | └── ob_proxy                                  | 2023-06-30 15:30:59.503655 | 2.648 ms   |
      |     ├── ob_proxy_partition_location_lookup    | 2023-06-30 15:30:59.503658 | 0.017 ms   |
      |     └── ob_proxy_server_process_req           | 2023-06-30 15:30:59.503757 | 2.466 ms   |
      |         └── com_query_process                 | 2023-06-30 15:30:59.503856 | 2.248 ms   |
      |             └── mpquery_single_stmt           | 2023-06-30 15:30:59.503861 | 2.236 ms   |
      |                 ├── sql_compile               | 2023-06-30 15:30:59.503869 | 1.850 ms   |
      |                 │   ├── pc_get_plan           | 2023-06-30 15:30:59.503871 | 0.003 ms   |
      |                 │   └── hard_parse            | 2023-06-30 15:30:59.503920 | 1.788 ms   |
      |                 │       ├── parse             | 2023-06-30 15:30:59.503927 | 0.013 ms   |
      |                 │       ├── resolve           | 2023-06-30 15:30:59.503955 | 0.387 ms   |
      |                 │       ├── rewrite           | 2023-06-30 15:30:59.504383 | 0.657 ms   |
      |                 │       ├── optimize          | 2023-06-30 15:30:59.505058 | 0.419 ms   |
      |                 │       └── code_generate     | 2023-06-30 15:30:59.505512 | 0.105 ms   |
      |                 └── sql_execute               | 2023-06-30 15:30:59.505729 | 0.296 ms   |
      |                     ├── open                  | 2023-06-30 15:30:59.505729 | 0.016 ms   |
      |                     ├── response_result       | 2023-06-30 15:30:59.505753 | 0.216 ms   |
      |                     │   └── do_local_das_task | 2023-06-30 15:30:59.505766 | 0.095 ms   |
      |                     └── close                 | 2023-06-30 15:30:59.505976 | 0.038 ms   |
      |                         ├── close_das_task    | 2023-06-30 15:30:59.505977 | 0.005 ms   |
      |                         └── end_transaction   | 2023-06-30 15:30:59.506006 | 0.002 ms   |
      +-----------------------------------------------+----------------------------+------------+
      20 rows in set
      

    You can first demarcate the issue based on the result. Specifically, you can analyze the time consumption at the following timestamps to quickly learn about the overall execution time in the database to facilitate further analysis and optimization.

    • The driver has only one timestamp named oceanbase_jdbc or obclient, respectively corresponding to JDBC and OBClient. This timestamp records the duration from the time when the client sends an SQL request to the time when the client receives a response.

    • ob_proxy is the start timestamp of ODP. It records the duration from the time when ODP receives an SQL request to the time when ODP sends a response to the client. The time difference between obclient and ob_proxy approximates the time overhead in network transmission plus the time for packet receiving and sending between the driver and ODP. You can find the difference in Example 1 and Example 2.

    • ob_proxy_server_process_req is the duration from the time when an SQL request is sent to the time when the first response is received from the OBServer node. It equals the value of the request processing time on the OBServer node plus the network transmission time for sending the response.

    • com_query_process is the total timestamp of OceanBase Database. It records the duration from the time when the OBServer node receives an SQL request to the time when the OBServer node returns a response.

  • Run the show trace format='json'; command to obtain the result set in JSON format.

    Run the show trace format = 'json'; command to obtain the result set in JSON format. You can format the result set to facilitate collection and analysis, as shown in the following figure.

    Figure 1

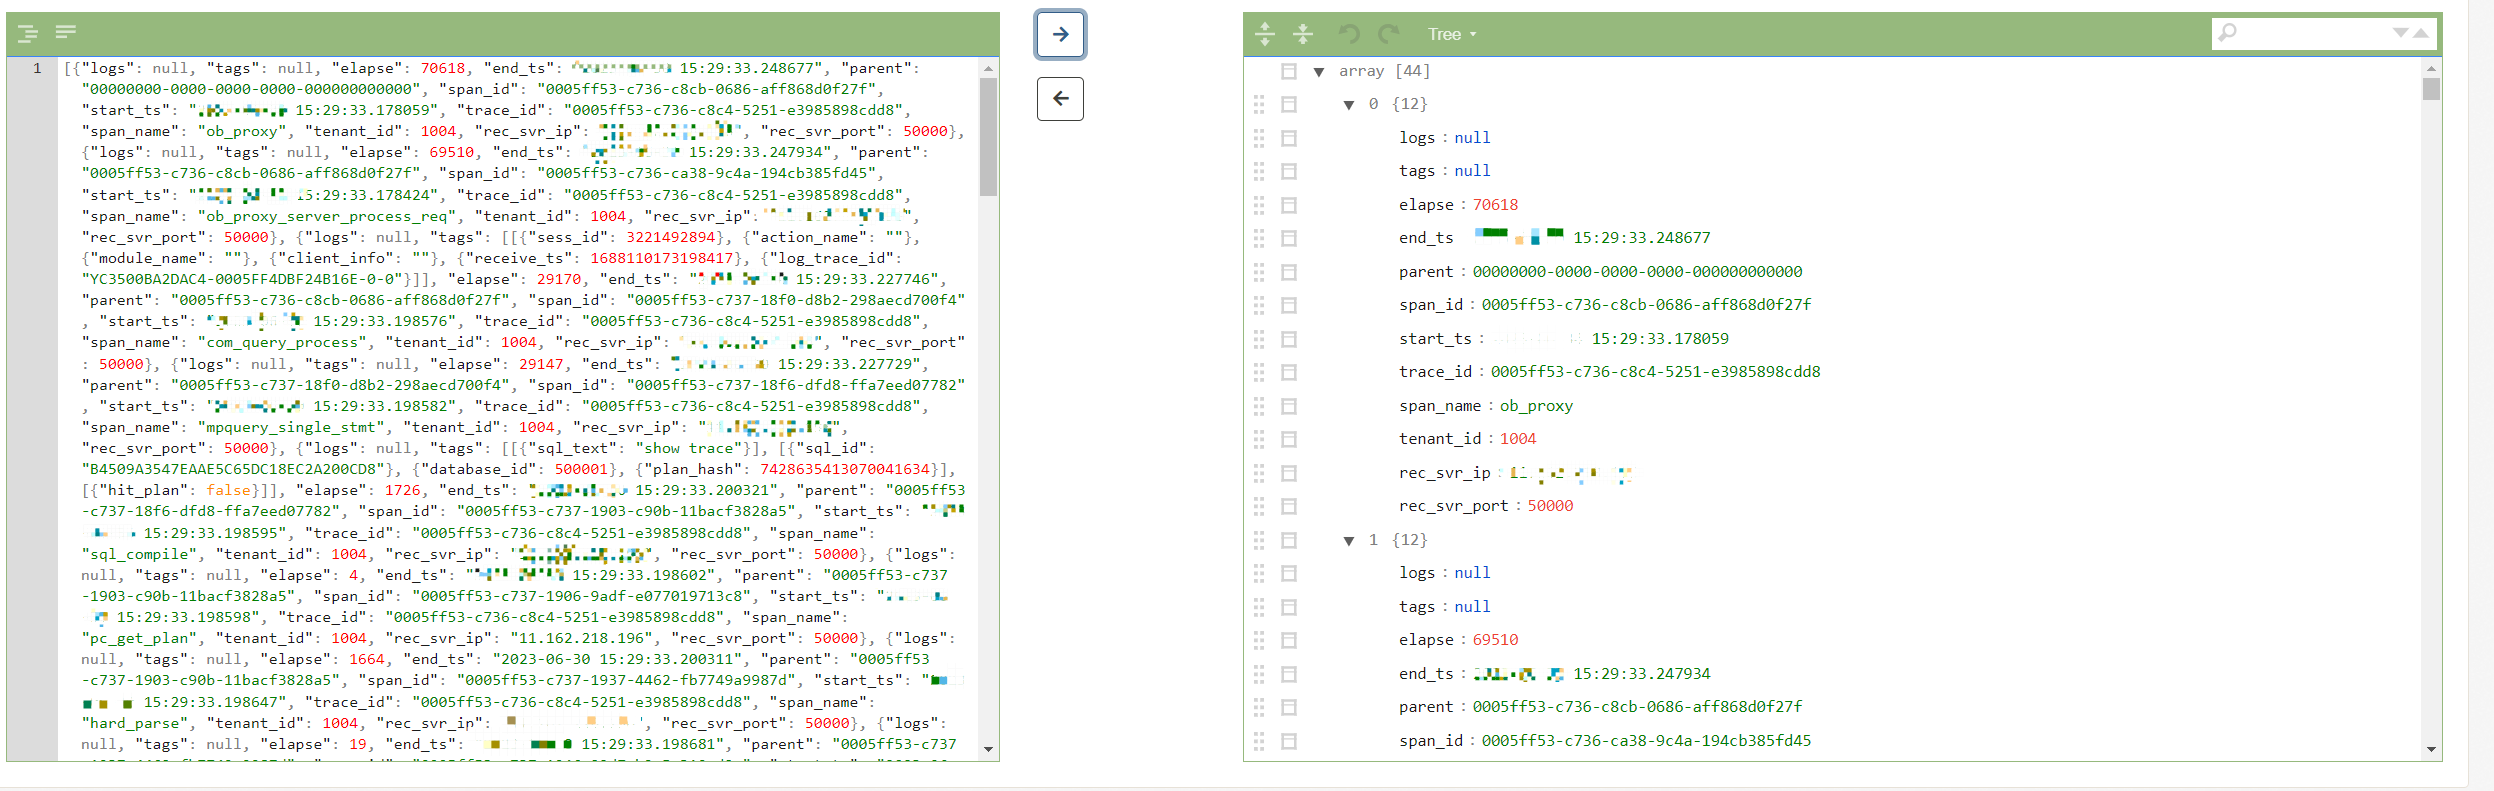
You can repeatedly run the show trace; or show trace format='json'; command to view the result in real time.

Step 4: Disable the Show Trace feature

After analysis, run the following command to disable the session-level Show Trace feature to avoid affecting the performance.

obclient> set ob_enable_show_trace='off';

Previous topic

Performance analysis
Last

Next topic

Overview
Next
What is on this page
Background
Supported versions of the components
Considerations
Procedure
Step 1: Configure the components
Step 2: Enable the Show Trace feature and execute the target SQL query
Step 3: Use the Show Trace feature
Step 4: Disable the Show Trace feature