







Background information
The ODC SQL window provides a user interface for processing data. In the SQL window, you can perform system evaluation on SQL statements, view execution records, and obtain end-to-end execution time information.
This document uses the employee table as an example to describe how to perform system evaluation on a query SQL statement.
Execution plan
In the SQL window, edit the SQL statement to query the data inserted into the
employeetable.SELECT `emp_no`, `birthday`, `name`, `time`, `test_col`, `status`, `age`, `state` FROM `employee`;As shown in the figure above, select the SQL statement and click the execution plan icon. The system estimates the execution data (the result of the EXPLAIN PLAN operation) before executing the SQL statement. The displayed execution data may differ slightly from the actual data after statement execution.
On the Plan Details page, click Text View to switch to the formatted display page.
Execution record
Note
- For versions earlier than OceanBase Database V4.2.4, when executing an SQL statement, you can view the basic execution information, time statistics, I/O statistics, executed SQL statement, plan statistics, and outline through Execution Records on the result set tab.

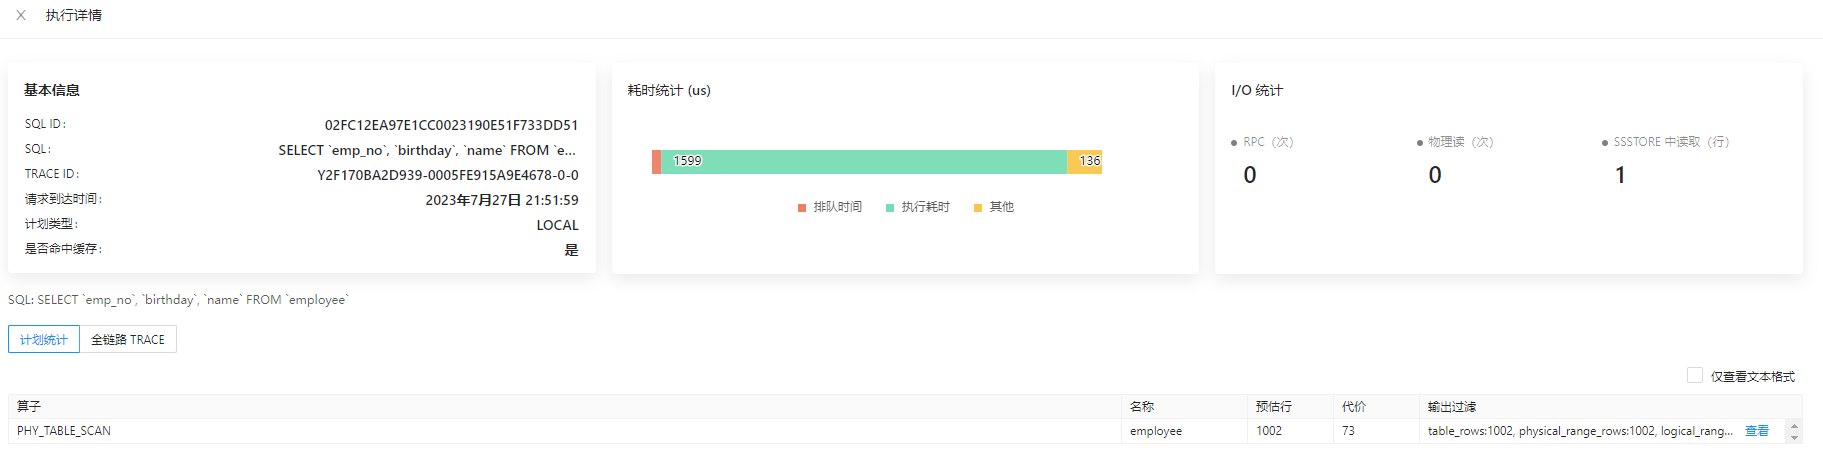
- For versions OceanBase V4.2.4 and later but earlier than OceanBase V4.3.0, or for versions OceanBase V4.3.3.1 and later, when you execute queries/inserts/updates/deletes/retrieval operations on database data, you can use Execution Profile to query the execution analysis of SQL statements in real time. This allows you to quickly view SQL execution records and identify performance bottlenecks.
Accessing the execution profile
Method 1: While executing an SQL statement in the SQL window, you can click View Execution Profile on the Logs tab during execution.
Notice
If the execution time of the SQL statement is less than 1 second, the entry for accessing the execution profile may not be displayed on the Log tab.
Method 2: After the SQL statement execution is complete, you can click the execution profile icon in the execution results.
Method 3: After the SQL statement execution is complete, you can click the TRACE ID on the Execution Records tab to enter the execution profile interface.
Execution analysis
Execution Details, also known as the execution profile, provides visualization and data collection for SQL execution plans. It supports real-time viewing of operator execution status, time details, I/O, and runtime data, and summarizes and ranks the overall execution time.
Through execution profiles, you can:
View the actual execution plan of OceanBase in a graphical format, making it easier to understand operator execution order and connection relationships.
Quickly identify execution bottlenecks through the execution overview, real-time I/O statistics, and the top 5 time-consuming operations. ODC sorts these based on CPU time.
Query the execution status, time, and output row count of operators in real time. By clicking an operator node, you can view its attributes, timing details, as well as I/O and other runtime data on the right side.
Supports analyzing single-machine execution plans and distributed execution plans. Parallel execution operators can be sorted by DB time, I/O memory, and output row count to quickly locate data skew.
SQL Execution Overview
Type |
Parameter description |
|---|---|
| SQL Execution Overview | 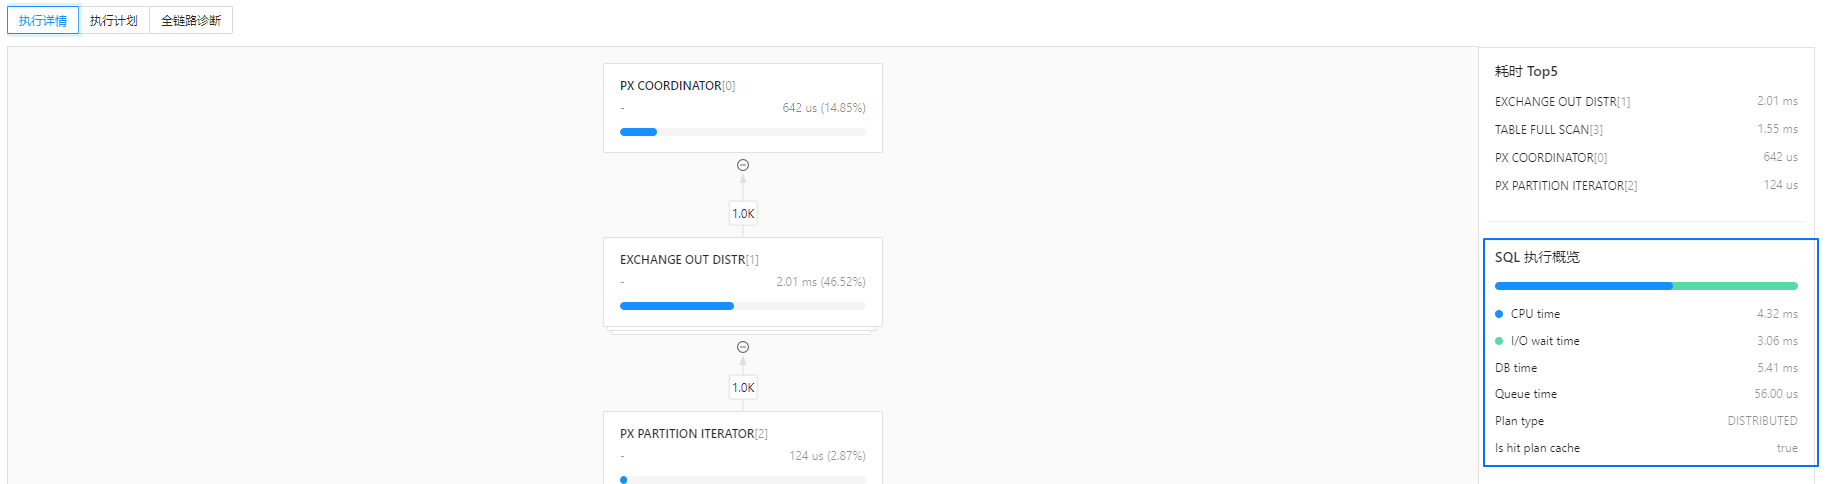
|
| Operator Execution Overview | 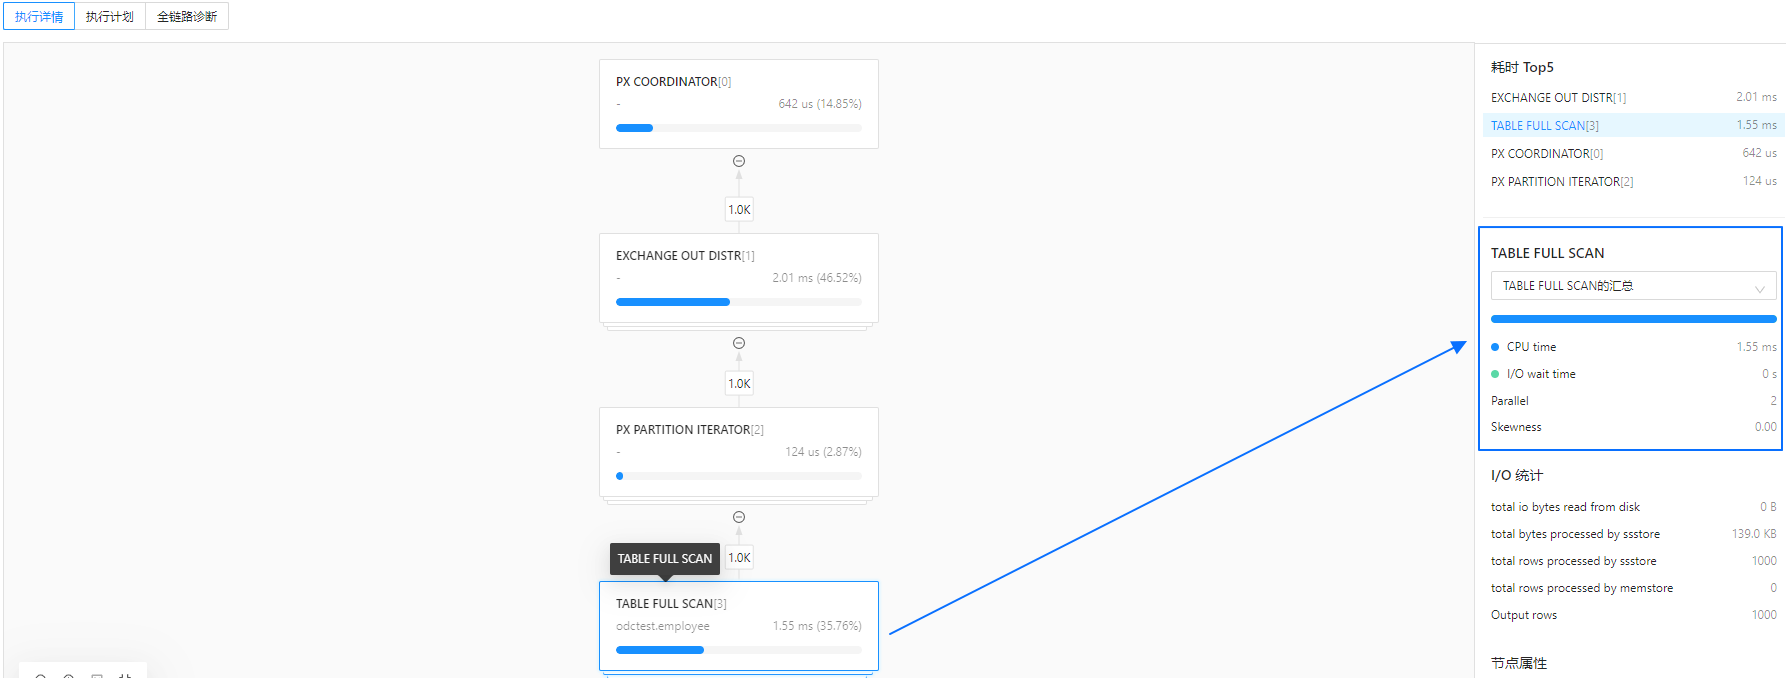
|
I/O Statistics
Type |
Parameter description |
|---|---|
| Operator I/O Statistics |
|
Node Attributes
Node attributes consist of the operator's output information and runtime data (Other statistics).
For more node output information, refer to the official OceanBase documentation, for example, Attributes of a Table Scan operator.
Runtime data represents different meanings on different operators and serves as important monitoring metrics. For such metrics, refer to the V$SQL_MONITOR_STATNAME view.
Execution Plan
Unlike the Execution Plan in the SQL window, the execution plan in the Execution Profile displays the actual execution plan, thus including Actual Rows and Actual Cost. ODC obtains the current plan using the DBMS_XPLAN package.
You can also click Text View  in the upper-right corner to switch views and query more comprehensive plan information, facilitating further SQL tuning.
End-to-End Diagnostics
When the OceanBase version is higher than 4.2.0 (if connecting via OBProxy, the version should be OBProxy V4.2.0 or later), ODC supports viewing visualized end-to-end diagnostic information for SQL. For more information, see Overview of OceanBase End-to-End Tracing.
For OceanBase's end-to-end diagnostic data, ODC provides two visualization views: Trace View and List View.
The Trace View displays the overall SQL execution timeline, supports expanding and collapsing nodes, and supports search highlighting. Hovering the mouse over the timeline allows you to view the execution node, start and end times, and detailed data for the current node.
Click Table View  to switch views, allowing filtering and sorting of Spans across various dimensions.
ODC supports exporting end-to-end diagnostic data in JSON format, which is compatible with the OpenTracing protocol. You can import it into Jaeger for further analysis.
Database Time Consumption
On the Execution Logs tab, you can hover over the tooltip icon next to the DB Time information. The popup message displays the end-to-end time consumption of the SQL execution, allowing you to verify whether the time spent in each stage matches the actual execution.