


OCP monitors its own operations to ensure stable system operation, improve operational efficiency, and enhance the user experience. By monitoring its own runtime status in real time, users can promptly detect service anomalies, resource bottlenecks, and potential faults, such as abnormal Agent access, network latency, or full GC, thereby avoiding disruptions to the normal management of OceanBase Database due to platform issues and ensuring business continuity.
Monitoring data also provides a basis for resource optimization. By analyzing resource utilization rates such as CPU and memory, you can adjust resource allocation appropriately to improve overall system performance. Furthermore, through in-depth analysis of logs and metrics, O&M personnel can quickly identify the root causes of problems, achieve precise fault repair, and significantly reduce troubleshooting time. Additionally, continuous accumulation of monitoring data helps predict system performance trends, allowing for early planning of scaling and upgrades to meet business growth needs and provide users with more reliable, efficient, and low-maintenance database management services.
Prerequisites
- When enabling or disabling platform monitoring, ensure the currently logged-in OCP user has the ADMIN role permission.
- When viewing platform monitoring data, ensure the currently logged-in OCP user has the ADMIN or ADMIN_VIEWER role permission.
Considerations
Enabling OCP platform monitoring may consume significant resources. Decide whether to enable it based on your actual resource situation.
Procedure
Enable platform monitoring
- Log in to OCP.
- In the left navigation bar, select System Management > Platform Monitoring, then click Enable Platform Monitoring.
- In the dialog box, click Enable.
- (Optional) To ensure performance monitoring data is displayed correctly, after enabling platform monitoring, we recommend that you manually restart the OCP service by referring to Start and stop OCP (Enterprise Edition) or Restart OCP (Community Edition).
View platform monitoring details
After enabling platform monitoring, you can go to the platform monitoring page to view OCP platform monitoring details.
View basic OCP platform information.
ParameterDescriptionOCP Cluster Name The name of the current OCP cluster, displayed only in multi-cluster OCP mode. ID The ID of the current OCP cluster, displayed only in multi-cluster OCP mode. Version Number The version number of the current OCP. Current Access Address The access address of the current OCP. View OCP platform access address details.
ParameterDescriptionAccess Address The access address of OCP, which can be copied. Status The current running status of OCP. Running Time The duration since the OCP service started until the current moment. Start Time The last start time of the OCP service. View OCP platform monitoring data.
Performance Monitoring:
MetricMeasureDescriptionUnitCPU Usage system_cpu_usage OCP CPU usage % Disk Usage disk_percent OCP disk usage % System Load (1m) system_load_average OCP system load per minute - Number of Available Processors system_cpu_count Number of available processors in OCP - JVM GC Count gc_total Number of JVM GCs in OCP - JVM GC Time gc_time JVM GC time in OCP μs JVM Memory Usage - jvm_heap_memory_used_bytes
- jvm_nonheap_memory_used_bytes
- jvm_heap_memory_used_bytes: Used heap memory in OCP JVM
- jvm_nonheap_memory_used_bytes: Used off-heap memory in OCP JVM
Byte JVM Memory Usage Rate - jvm_heap_memory_used_percent
- jvm_nonheap_memory_used_percent
- jvm_heap_memory_used_percent: Heap memory usage rate in OCP JVM
- jvm_nonheap_memory_used_percent: Off-heap memory usage rate in OCP JVM
% JVM Start Time process_start_time_seconds OCP JVM start time s JVM Runtime process_uptime_seconds OCP JVM runtime s JVM Memory Distribution - used
- committed
- max
- used: Memory used by OCP JVM
- committed: Total memory available for OCP JVM (including used memory)
- max: Maximum memory that can be allocated to OCP JVM
byte HTTP Requests:
MetricSub-metricDescriptionUnitAverage number of successful HTTP requests per second success_count Average number of successful HTTP requests processed per second in OCP - Average number of failed HTTP requests per second fail_count Average number of failed HTTP requests processed per second in OCP - Time spent on a successful HTTP request success_time Time spent on each successful HTTP request in OCP s Time spent on an HTTP request fail_time Time spent on each failed HTTP request in OCP s
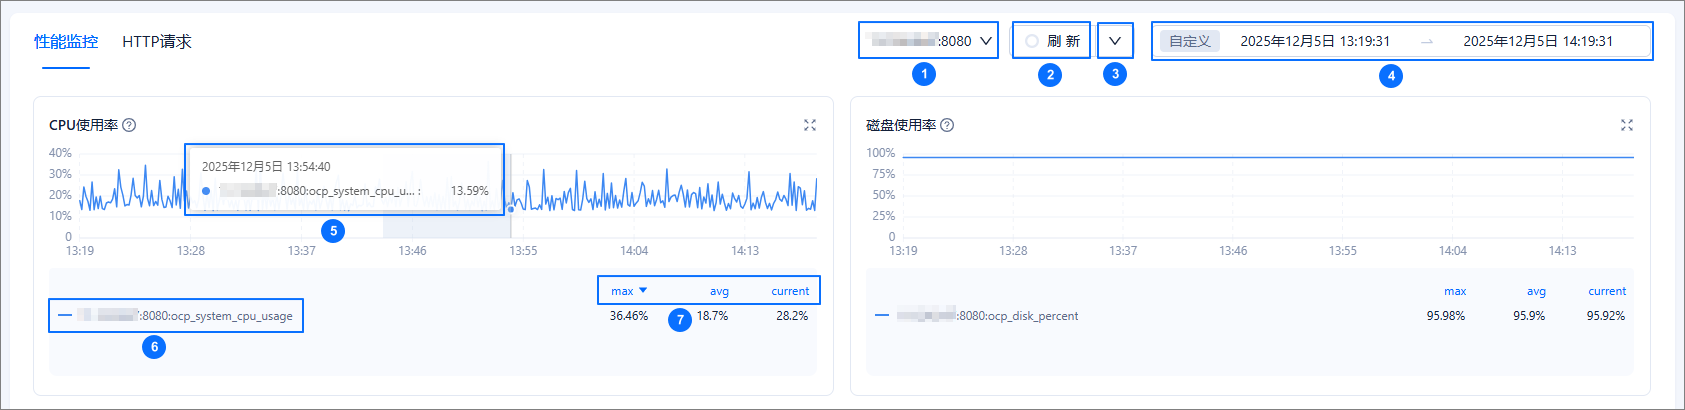
The following features help you better view and analyze performance monitoring data in trend charts. You can understand them with the help of the following text and figures:
- ①: By default, only one host's data is displayed. You can switch between hosts in the list.
- ②: Click Refresh to refresh the monitoring data once.
- ③: Automatic refresh is supported. After enabling it, the monitoring data will be refreshed automatically at the selected frequency.
- ④: You can select a time range to retrieve the monitoring data within that period.
- ⑤: Hover the cursor over a point in time on the trend chart to view detailed data for that moment. Drag the cursor to select an area, and the system will zoom in to display the trend information for that region. You can view the detailed trend of the metric during this period. Double-click the trend chart to restore it.
- ⑥: Click another sub-metric label to gray it out, and that metric's information will not be displayed in the trend chart.
- ⑦: All monitoring items support displaying the maximum value (max), average value (avg), and current value (current) for each sub-metric. Click max, avg, or current to sort the data in that column in ascending or descending order.
Disable Platform Monitoring
Click Disable Platform Monitoring in the upper-right corner of the page to stop collecting OCP platform monitoring data. After disabling platform monitoring, to avoid resource waste caused by monitoring collection, we recommend that you manually restart the OCP service by referring to Start and Stop OCP (Enterprise Edition) or Restart OCP (Community Edition).
Related Operations
In the HTTP Requests monitoring chart, the top 10 HTTP requests of the platform are displayed by default. You can modify the number of top HTTP requests in the ocp.self.monitor.http.top.count parameter under System Management > System Parameters.