
Meet OceanBase AI Database, the unified database for operational data, real-time analytics, and AI. Explore ->
Meet OceanBase AI Database, the unified database for operational data, real-time analytics, and AI. Explore ->
Why Streaming Workloads Break Most Vector Databases: A Benchmark of 5 Popular Engines
- If you are picking a vector database for an AI agent, ignore "bulk-load QPS" and look at concurrent P99 under sustained writes
- Under streaming load, P99 jitter (concurrent P99 / serial P99) ranged from 1.1× to 10.3× across six engines on identical hardware
This post has results for five vector databases — seekdb, Elasticsearch, Milvus, Qdrant and Chroma — on a streaming workload using the Cohere-10M dataset. The dataset has 768 dimensions and uses cosine as the distance metric. The standard ann-benchmarks shape (bulk-load, then read-only queries) is not what an AI agent does in production. Agents write and read concurrently, at millisecond intervals. So I used VectorDBBench’s StreamingPerformanceCase, which sustains writes at a fixed rate while issuing concurrent queries.
Editorial
I have a bias. Most published vector benchmarks describe a workload that nobody runs in production. They bulk-load a dataset, build an index, then run read-only queries. That is fine for an offline embedding search; it is not what an agent does.
- An agent's loop is
memory.write(observation); relevant = memory.search(query)— milliseconds apart, concurrent - Production is expensive — you have to worry about SLAs and tail latency, not the median
- Picking a vector database from ann-benchmarks numbers is a bit like picking an OLTP database from TPC-H numbers
The thing I want to measure is how much P99 inflates when concurrency is added on top of sustained writes. Everything else is secondary.
Benchmark
I used VectorDBBench's StreamingPerformanceCase, an open-source benchmark maintained by Zilliz (the company behind Milvus). The full scripts, configs and raw output are at github.com/oceanbase/vdb-streambench — PRs welcome to add more systems.
- Dataset: Cohere-10M, 768 dimensions, cosine
- Hardware: 16 vCPU, 64 GiB RAM
- Index: HNSW with identical parameters everywhere —
M=16, ef_construction=256, ef_search=200 - Write rate: sustained 500 rows/sec
- Snapshot point: recall measured at 80% write progress (theoretical max recall for this case is 0.80)
Engines and versions:
- seekdb 1.3.0 (async, two-index mode)
- seekdb 1.2.0 (sync, segment-per-batch mode — included to isolate the architecture change)
- Elasticsearch v9.3.3
- Milvus v2.6.9
- Chroma 1.5.9
- Qdrant 1.17.1
I used each engine's default config except where the documentation explicitly recommends a streaming-specific knob. I made a good faith effort to get good results from every engine; if I missed a knob, file an issue on the repo above.
Results: QPS, P99 and jitter under concurrency
The columns I care about are concurrent P99 and P99 jitter. Most benchmark tables don't report jitter — that is the gap between what the engine looks like serially and what it looks like under load.
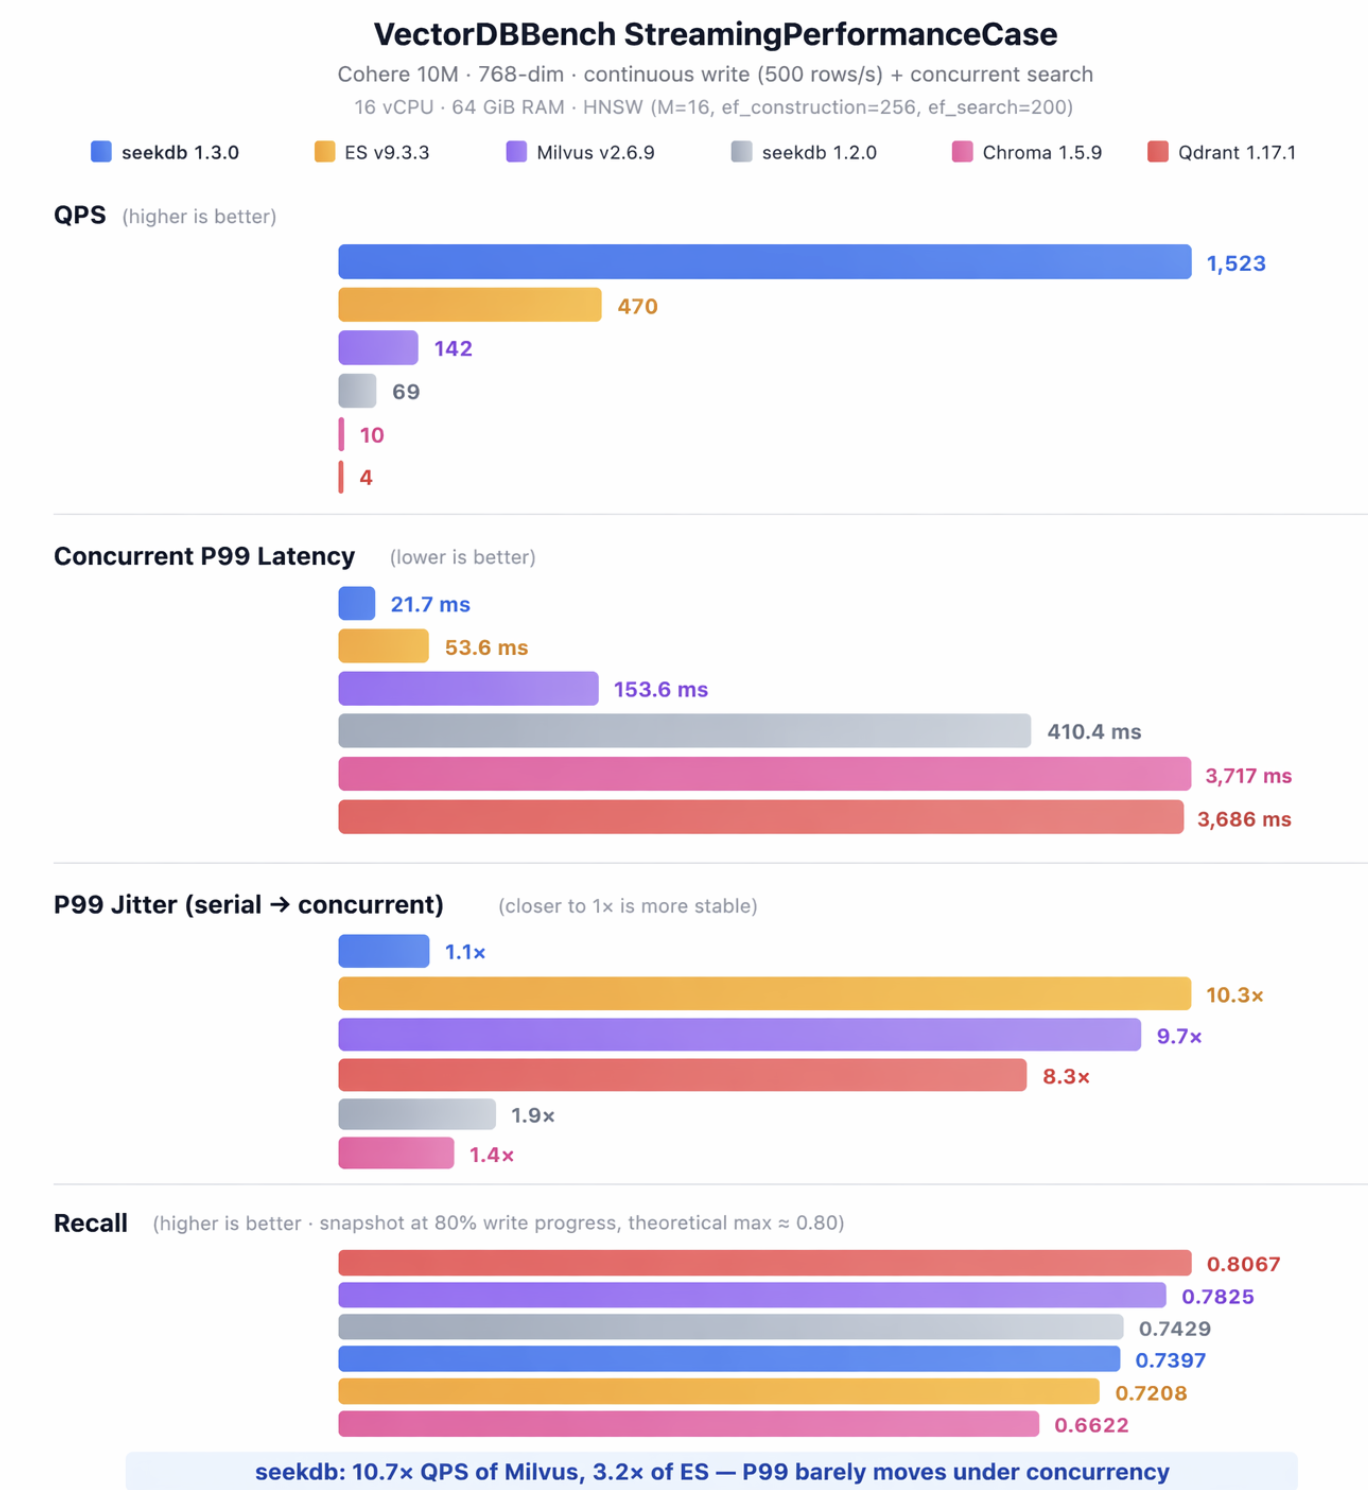
| dbms | QPS | serial P99 (ms) | concurrent P99 (ms) | jitter | recall |
| seekdb 1.3.0 (async) | 1523 | 19.7 | 21.7 | 1.1× | 0.7397 |
| Elasticsearch 9.3.3 | 470 | 5.2 | 53.6 | 10.3× | 0.7825 |
| Milvus 2.6.9 | 142 | 15.9 | 153.6 | 9.7× | 0.7208 |
| seekdb 1.2.0 (sync) | 69 | 212 | 410.4 | 1.9× | 0.7429 |
| Chroma 1.5.9 | 10 | 2700 | 3717 | 1.4× | 0.8067 |
| Qdrant 1.17.1 | 4 | 444 | 3686 | 8.3× | 0.6622 |
Observations:
- Elasticsearch has the fastest serial P99 in the table (5.2 ms). The moment you add concurrent queries on top of sustained writes, P99 climbs 10.3× to 53.6 ms. Bulk-load benchmarks miss this entirely.
- Milvus inflates 9.7× — same shape as Elasticsearch, different absolute numbers.
- Qdrant returns only 4 QPS with 3,686 ms P99 and 8.3× jitter on this workload. I am new to Qdrant; the result is bad enough that I expect either a tuning miss or an architectural mismatch with sustained writes. The repo above has my exact configs.
- Chroma has low jitter (1.4×) but absolute latency is so high (3,717 ms) that the low jitter doesn't help.
- seekdb 1.3.0 inflates 1.1× — P99 barely moves between serial and concurrent.
This is not a tuning problem. It is an architectural one.
Why segment-based engines blow up under streaming
Milvus, Elasticsearch and Qdrant are good at the workloads they were designed for: bulk ingestion followed by read-only queries. The structural assumption baked into all three is that every batch of writes produces a new index segment. At query time the engine fans out to N segments, runs k-NN against each, and merges. With one query thread that is fine. With M concurrent threads against N segments, you get N×M units of work fighting for CPU, and tail latency goes with it.
Two things follow from that:
- Segment count grows with cumulative writes — the longer the agent runs, the more segments
- Concurrent queries amplify the fanout cost — each new query thread multiplies CPU contention by N
Results: seekdb sync → async, the architectural change
seekdb 1.2.0 has the same segment-per-batch path as the engines above, and posts the same kind of numbers (69 QPS, 410 ms concurrent P99). seekdb 1.3.0 ships a different write/query path:
- Decoupled write path. A commit only writes the redo log synchronously. A background pipeline consumes the log and applies vectors to an in-memory delta index. Writes never block on indexing; indexing never blocks on writes.
- Fixed two-index query path. The engine maintains a delta HNSW (incremental layer for new writes) and a snapshot HNSW (steady-state main index), modeled after the LSM-tree pattern from KV stores. A query runs k-NN against both and merges. The number of indexes a query has to touch is fixed regardless of cumulative write volume.
Same product, same dataset, same hardware:
| mode | QPS | serial P99 (ms) | concurrent P99 (ms) | recall |
| sync (segment-per-batch) | 69 | 212 | 410.4 | 0.7429 |
| async (two-index) | 1523 | 19.7 | 21.7 | 0.7397 |
- 22× QPS
- 19× concurrent P99
- recall flat (~0.74)
The change is structural. There is no tuning knob in the sync mode that closes this gap, because the fanout cost is paid at query time and the sync mode keeps producing more segments to fan out to.
Results: scaling across dataset sizes (async, same hardware)
| dataset | QPS | serial P99 (ms) | concurrent P99 (ms) | recall |
| Cohere-100K | 5774 | 2.3 | 3.9 | 0.7902 |
| Cohere-1M | 2531 | 14.6 | 14.2 | 0.7636 |
| Cohere-10M | 1523 | 19.7 | 21.7 | 0.7397 |
P99 grows sub-linearly with dataset size, which is what you want from an HNSW with a fixed query fanout.
What you should benchmark instead
If you are evaluating a vector database for an agent, the four numbers worth measuring are:
- Streaming write + concurrent read. Sustain writes at the rate your agent actually writes at, with concurrent queries on top. Measure P99 under concurrency, not serial.
- P99 jitter ratio =
concurrent P99 / serial P99. Anything above 2× means the architecture has a concurrency problem you cannot tune away. - QPS under write pressure. QPS on a static dataset is the wrong number.
- Latency stability over time. Run the test for hours. Segment-based engines creep upward as segments accumulate; fixed-index architectures stay flat.
Stop optimizing for bulk-load QPS. Start measuring concurrent P99 under sustained writes. That is the number that decides whether your agent's SLA holds.
If you're choosing a database for your Agent — take 30 seconds to run the demo above.
⭐ github.com/oceanbase/seekdb — a star helps more people discover this project and motivates us to keep investing in it.
Questions or want to discuss your Agent use case: GitHub Issues · GitHub Discussions


Keep Reading
View all posts
From Complex to Simple: How We Built seekdb for the AI Era
AI era doesn't need another heavy, complex enterprise database. It needs agility. It needs flexibility. We went back to the drawing board to understand what an AI application actually needs from a database. Our answer is OceanBase seekdb


Beyond Fine-tuning: Solving DABstep's Hard Mode with Versioned Assets
On the DABstep Global Leaderboard, OceanBase DataPilot agent has secured the top spot, maintaining a significant lead over the runner-up for a month. The secret to our SOTA results was a fundamental shift in engineering paradigm: moving from "Prompt Engineering" to "Asset Engineering."

Permanent Server Offline in OceanBase: How the Cluster Heals After a Node Is Gone
How OceanBase distinguishes a transient outage from a permanent loss, and why operators should intervene rather than wait for the automatic re-replication timer.
